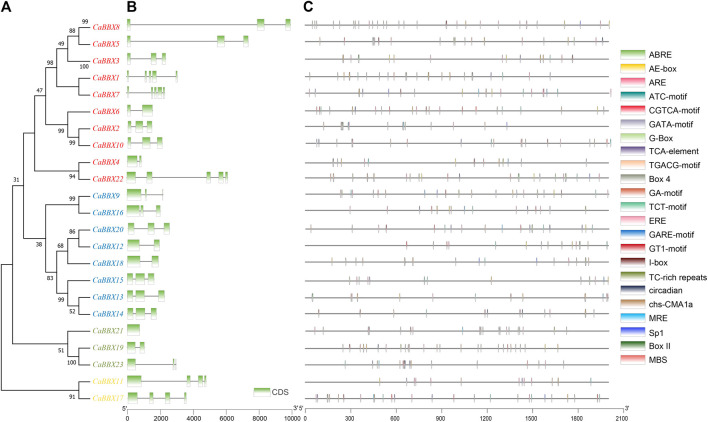
FIGURE 2.
Phylogenetic relationships, gene structure analysis, and predicted cis-elements of CaBBXs. (A) Phylogenetic tree for the 23 CaBBXs. Red genes were classified in Group I, blue members belonged to Group II, green genes to Group III, and yellow members to Group IV. (B) Green boxes represent the coding sequence (CDS) regions while intron regions are indicated by black lines. Exon lengths can be inferred from the scale at the bottom. (C) Promoter sequences (−2,000 bp) of CaBBXs were analyzed using PlantCARE. Different shapes and colors represent different elements. Annotated cis-elements are listed in Supplementary Table S1.

