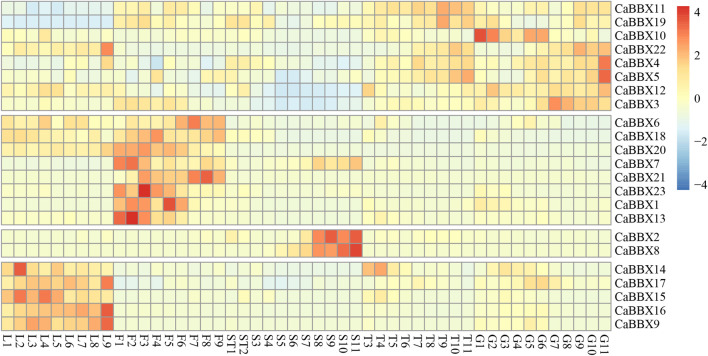
FIGURE 4.
A Expression patterns of CaBBXs. Expression profiles using RNA-seq fragments per kilobase million (FPKM) data in the leaves between ten DAP and 60 DAP (L1–L9), flowers between ten DAP and 50 DAP (F1-F9), placenta and seed between ten DAP and 15 DAP (ST1 and ST2), the placenta between 20 DAP and 60 DAP (T3–T10), and pericarp between ten DAP and 60 DAP (G1–G11).

