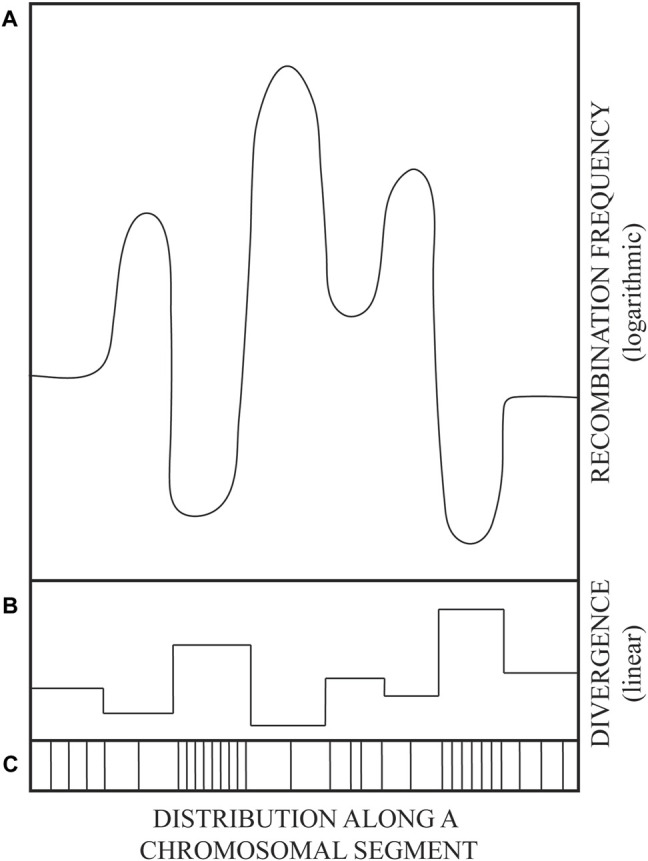
FIGURE 1.

A drawing illustrating the variation in parental DNA sequence divergence (linear scale) and the corresponding variation in recombination frequencies (logarithmic scale). Schematized mirror image of DNA sequence divergence (B), recombination frequency (A), and the distribution of polymorphism (mutations) along an evolutionarily related genome segment (C). Sketched from data in figures 4 and 5 of (Martinsohn et al., 2008). See also main text.
