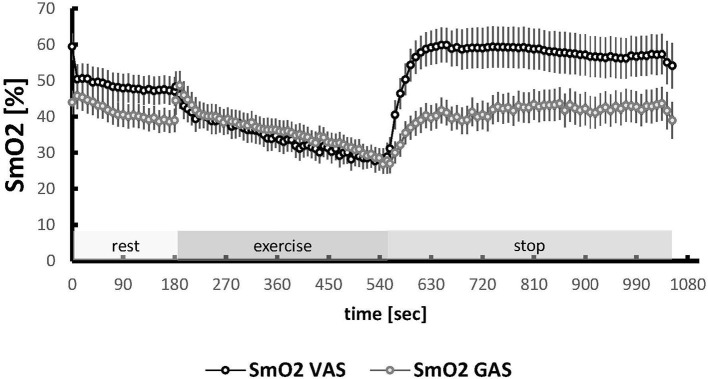
Figure 2.
Oxygen saturation in VAS and GAS during the ramp test. Line graph visualizing the mean + SE (circle and vertical bars) of values for SmO2 in VAS and GAS during the course of the ramp test. The three phases of the test are indicated. Values were averaged to each 9 s interval for the measures from the 34 subjects. The time coordinates for the values during the exercise phase were scaled for each subject to the duration of a reference data set.

