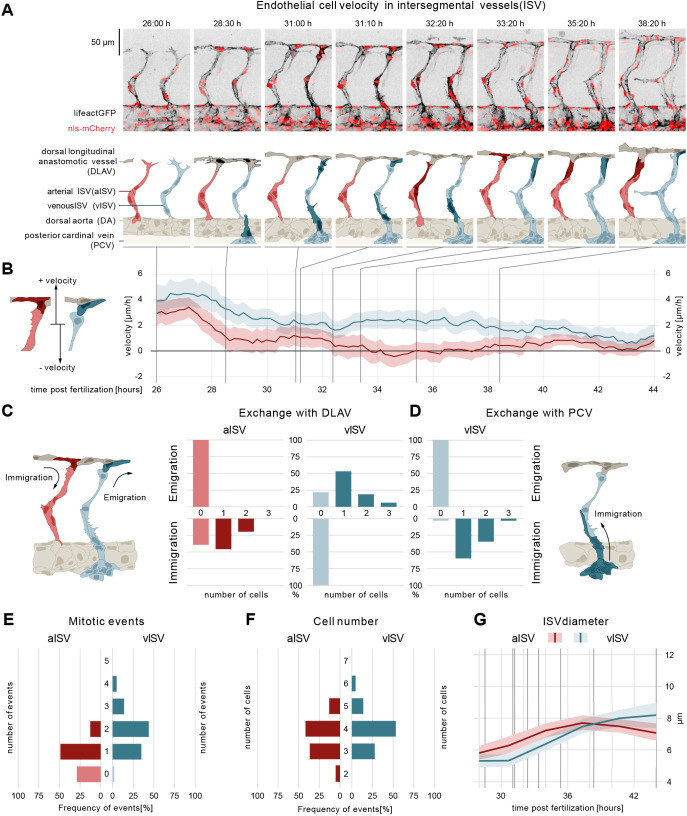
Fig. 1.
ECs of arterial and venous ISVs show different velocity profiles. (A) Montage of two ISV sprouts from 26-38 hpf. Top panel: live imaging of Tg[fliep:nls-mCherry; fliep:lifeactGFP]. Black, F-actin; red, nuclei. Bottom panel: pictogram of live imaging. Red ECs represent cells in aISV; blue ECs represent cells in vISV. Dark red ECs indicate cell division events (time point 32:20) and immigration of cells from DLAV to aISV (time points 33:20, 35:20-38:20). Dark blue cells indicate secondary sprouts (time point 28:30), vascular remodelling (time point 31:00, most ventral EC), cell division events (time point 31:00, most dorsal ECs), emigration of ECs towards the DLAV (time point 31:10, 33:20-38:20) and immigration of ECs from the PCV (time point 31:00-32:20). Dark grey cells represent cell anastomosis (time point 28:30). (B) EC velocity (µm/h) over time (hpf). Red, velocity for ECs in aISV; blue, velocity of ECs in vISV. Left pictogram demonstrates positive and negative velocity relative to dorsal and ventral movement, respectively. (C) Number of cells that exchange from ISVs with DLAV and fractions of ISVs that are affected. (D) Number of cells that exchange from PCV with vISV and corresponding fractions of vISVs. (E) Number of mitotic events in ISVs. (F) Cell number in ISVs 44 hpf and distribution among ISVs. (G) Vessel diameter (µm) over time (hpf) for aISV (red) and vISV (blue). Black vertical lines represent the equivalent time points in montage. Data are mean and 95% confidence interval.

