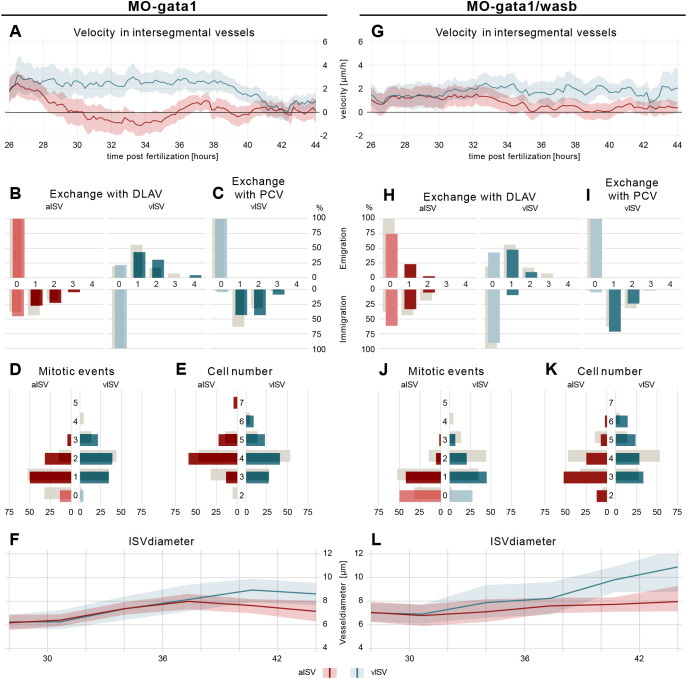
Fig. 4.
WSS prevents vessel diameter and cell number variability. (A) EC velocity (µm/h) over time (hpf) of MO-gata1 embryos. Red, velocity for ECs in aISVs; blue, velocity of ECs in vISV. (B) Number of cells that exchange from ISVs with DLAV and fractions of ISVs that are affected (AKS test P>0.05, MO-control versus MO-gata1). (C) Number of cells that exchange from PCV with vISV and corresponding fractions of vISVs. (D) Number of mitotic events in ISVs (AKS test P>0.05, MO-control versus MO-gata1). (E) Cell number in ISV at 44 hpf and distribution among ISVs (AKS test P>0.05, MO-control versus MO-gata1). (F) Vessel diameter (µm) over time (hpf) for MO-gata1 ISV (red line, aISV; blue line, vISV). (G) EC velocity (µm/h) over time (hpf) of MO-gata1/wasb embryos. Red, velocity for ECs in aISVs; blue, velocity of ECs in vISV. (H) Number of cells that exchange from ISVs with DLAV and fractions of ISVs that are affected (AKS test P>0.05, MO-gata1 versus MO-gata1/wasb). (I) Number of cells that exchange from PCV with vISV and corresponding fractions of vISVs. (J) Number of mitotic events in ISVs (AKS test aISV P<0.05, MO-gata1 versus MO-gata1/wasb; AKS test vISV P>0.05 MO-gata1 versus MO-gata1/wasb). (K) Cell number in ISVs 44 hpf and distribution among ISVs (AKS test aISV P<0.05, MO-gata1 versus MO-gata1/wasb; AKS test vISV P>0.05, MO-gata1 versus MO-gata1/wasb). (L) Vessel diameter (µm) over time (hpf) for MO-gata1/wasb ISV (red line, aISV; blue line, vISV). Grey bars (B-E,H-K) are values of MO-control. Data are mean and 95% confidence interval.

