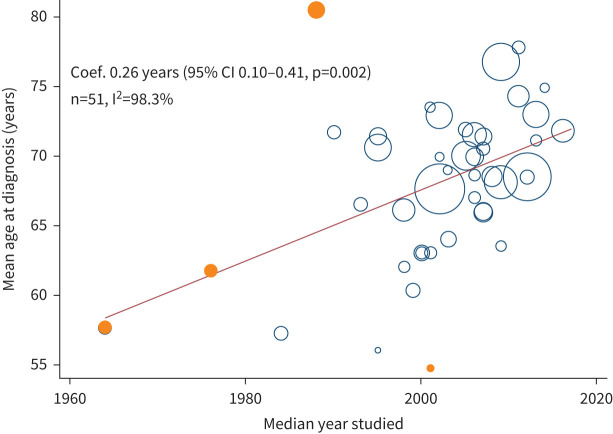
FIGURE 4.
Association between mean age at diagnosis and median year studied between 1960 and 2020 by using univariate meta-regression. Each size of the bubble depends on the weights in the random-effects models. Orange circles show studies removed for sensitivity analysis with extreme data points or before year 1980. Coef.: coefficient.

