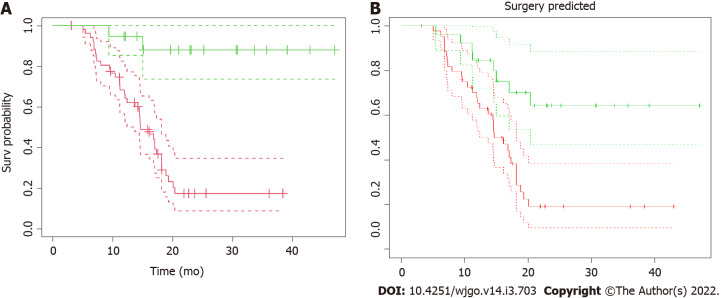
Figure 2.
Kaplan–Meier overall survival. A: Kaplan–Meier overall survival (OS) as a function of surgical resection. Patients were stratified according to resectability status and OS curves from radiotherapy for resected (green line) vs non-resected (red line) and their confidence intervals (dotted lines) were plotted. The median OS from radiation therapy for resected patients has not been reached, compared to 14.6 mo (CI: 12.4-18.1 mo) of non-resected patients (P < 0.001); B: Kaplan–Meier OS as a function of surgical resection as predicted by the model. The “predicted” OS curves from radiotherapy for resected (green line) vs non-resected (red line) patients and their confidence intervals (dotted lines) showed here were obtained applying the model to the dataset to predict the resectability status. The two curves are significantly different (P < 0.001).

