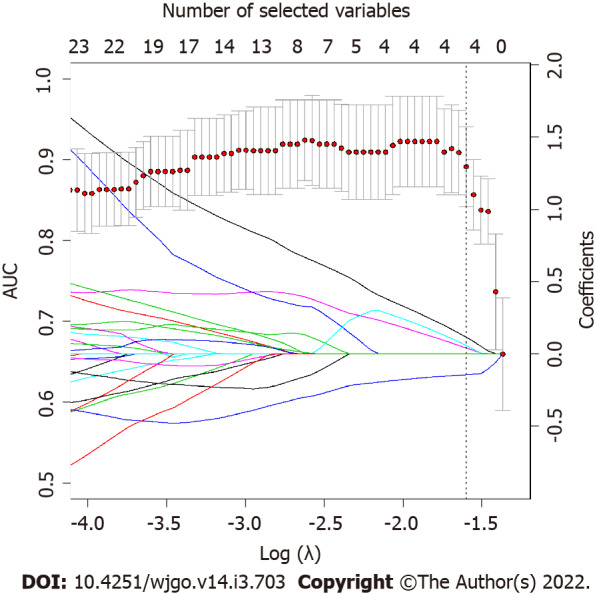
Figure 4.

LASSO regression coefficients and area under the receiver operating characteristic curve as function of lambda parameter. LASSO regression coefficients for each variable (represented by continuous lines, each line is a variable that are imposed to reach zero by LASSO regression as lambda increases) and area under the receiver operating characteristic curve (AUC) as function of Log(λ) are superimposed. Dotted line represents the best lambda parameters that corresponds to the value at one standard deviation after the lambda that maximize AUC. As it is possible to notice, the best lambda value corresponds to four variables selected by LASSO.
