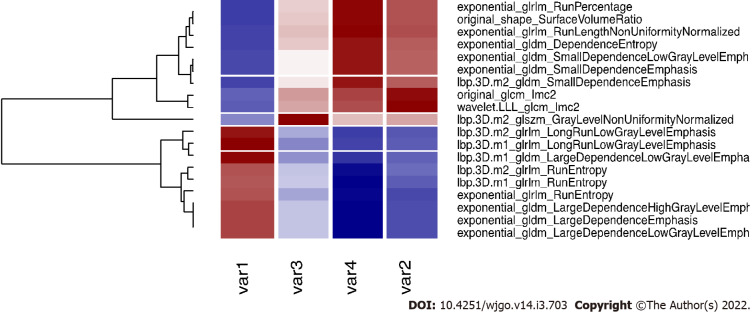
Figure 5.
Correlation plot of the selected variables and other significant features. The four selected variables (named var1, var2, var3 and var4 for simplicity, please refers to the end of this caption for the correspondence with variable names), are correlated (r > 0.9) with other variables that are rejected for further analysis. Here we report the correlated variables as reference for further studies that could find significant features correlated with our variables. Var1: Lbp.3D.m1_glrlm_LongRunLowGrayLevelEmphasis; Var2: Wavelet.LLL_glcm_Imc2; Var3: Lbp.3D.m2_glszm_GrayLevelNonUniformityNormalized; Var4: Exponential_glrlm_RunLengthNonUniformityNormalized.

