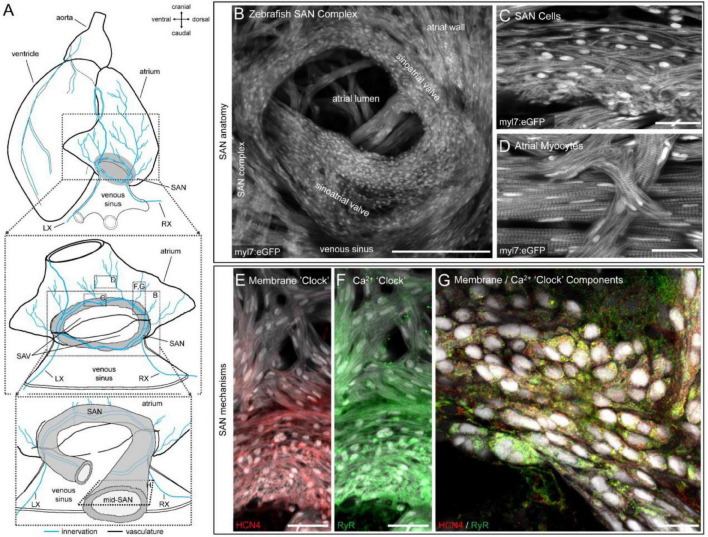
FIGURE 2.
Structure and channel expression in the zebrafish sinoatrial node (SAN). Schematic of the zebrafish heart illustrating the location of the images in B-H (A). Overview of the zebrafish SAN complex visualised by eGFP fluorescence in myl7-expressing cardiomyocytes (B). Morphology of SAN cells (C) and atrial myocytes (D) in a 5 μm confocal z-projection. Immunofluorescence of hyperpolarisation-activated cyclic nucleotide-gated channel-4 (HCN4, red; E) and ryanodine receptor (RyR, green; F) expression in a 50 μm confocal z-projection through the SAN and proximal atrial myocardium. Cellular distribution of RyR and HCN4 in a single optical plane from approximately the mid-SAN (G). Scale bars (in μm): (B): 200 μm; (C,D): 25 μm; (E,F): 40 μm; (G): 25 μm. LX, left cardiac branch of the vagal nerve; RX, right cardiac branch of the vagal nerves; SAV, sinoatrial valve.

