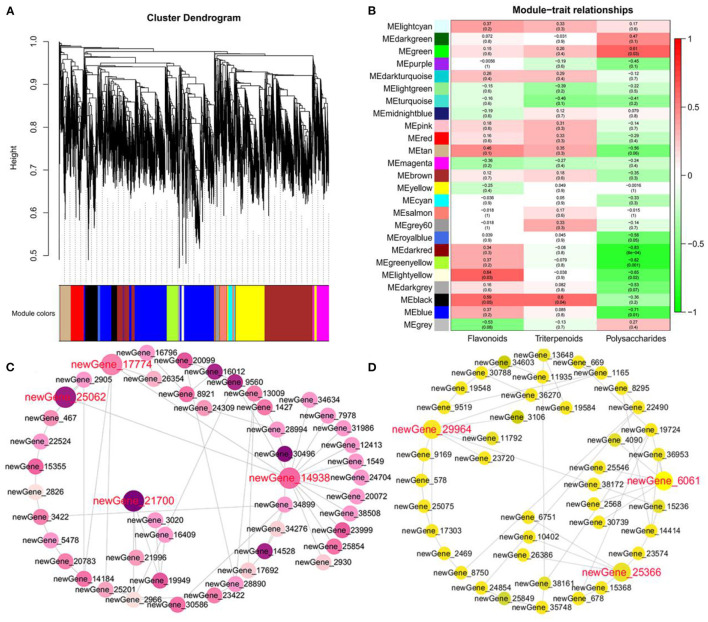
Figure 6.
Hub gene identification involved in hypoglycemic nutrient metabolites. (A) Tree diagram of all DEGs based on a value of dissimilarity measure (1-TOM). (B) Gene modules associated with the content of triterpenoids, polysaccharides, and flavonoids. (C) Coexpression network revealing the hub genes related to polysaccharides in the green module. (D) Coexpression network revealing the hub genes related to flavonoids in the light yellow module.

