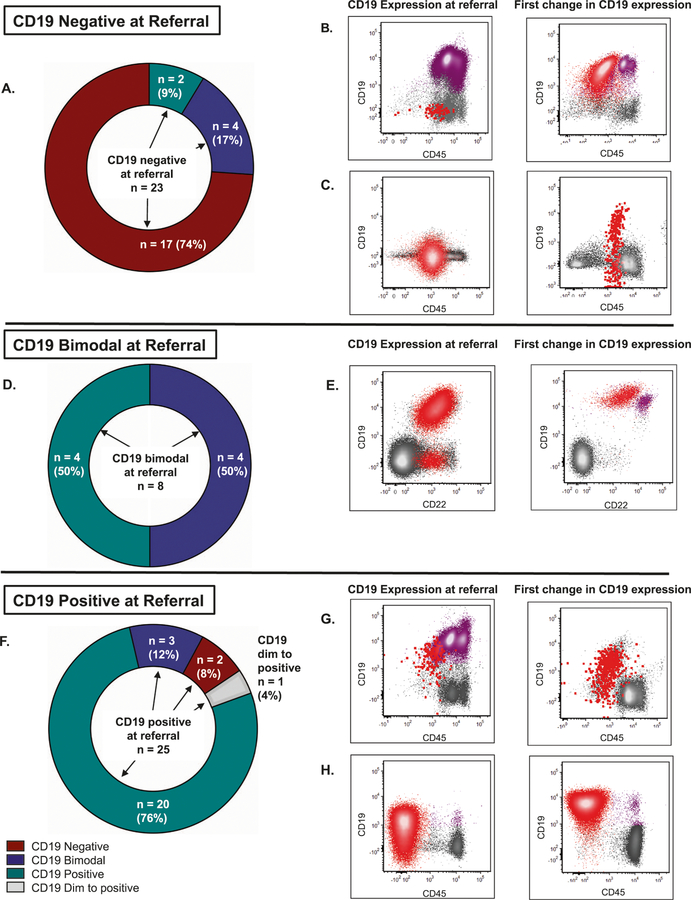
Fig. 1. Changes in CD19 Expression.
a, d, f Evolution of CD19 expression from referral CD19-negative (N = 23), -partial (N = 8), and -positive (N = 25) subgroups during follow-up at our institution. CD19 expression level at referral is noted in the middle of each graph with arrows pointing to specified changes in expression over time. Two patients elsewhere characterized as CD19-dim expressers (CD19 ABC ≤2000) are included with the CD19-positive patients and one whose expression evolved over time is distinguished (gray color). For the flow cytometry dot plots, referral cases (left-side rows) were chosen as the last case before a change in CD19 expression occurred and subsequent cases (right-side rows) were those immediately following the change. B-ALL blasts are shown in red. Nonneoplastic B cells are shown in purple. Representative flow cytometry dot plots are shown, and additional plots are shown in Fig. S3. b CD19-negative disease and abundant B-cell precursors and mature B cells, which later transition to fully CD19-positive disease with interval CD22 CAR and SCT. Additional flow cytometry plots depicting the disease immunophenotypes at both timepoints can be found in Fig. S3A. c CD19-negative disease which became partially CD19-positive (46% positive expression) with interval CD22 CAR. Additional flow cytometry plots depicting the disease immunophenotypes at both timepoints can be found in Fig. S3B. e CD19-partial/bimodal CD19 expression (87% positive expression), which later became fully CD19-positive with few nonneoplastic, predominantly mature B cells with no interval immunotherapy additional flow cytometry plots depicting the disease immunophenotypes at both timepoints can be found in Fig. S3C. g CD19-positive disease in a background of nonneoplastic B cells, which include abundant B-cell precursors/hematogones and mature B cells. Disease later became CD19-dim/partial positive (85% positive expression) with interval CD22 CAR. Additional flow cytometry plots depicting the disease immunophenotypes at both timepoints can be found in Fig. S3D. h Disease ranging from predominantly CD19-dim to negative (CD19 ABC = 665), which later became fully CD19-positive (CD19 ABC = 3767) with no interval immunotherapy. Few nonneoplastic, predominantly mature B cells are present. Additional flow cytometry plots depicting the disease immunophenotypes at both timepoints can be found in Fig. S3E.

