
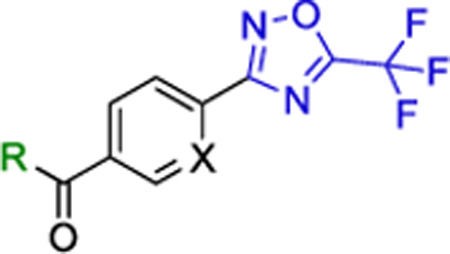
Table 3.
IC50 values for HDACs inhibition in HT-29 cells using class-distinguishing fluorogenic substrates whole-cell assay..
| ||||
|---|---|---|---|---|
| # | R | X | Class-Ila (uM) | Class-I/IIb (uM) |
| 9 |
|
CH | >5 | >15 |
| 10 |
|
CH | 0.933 ± 0.26 | >15 |
| 11 |
|
CH | 0.768 ± 0.19 | >15 |
| 12 |
|
CH | 0.905 ± 0.31 | >15 |
| 13 |
|
CH | 0.953 ± 0.31 | >15 |
| 14 |
|
CH | 0.537 ± 0.15 | >15 |
| 15 |
|
N | 1.710 ± 0.33 | >15 |
| 16 |
|
CH | 0.233±0.11 | >15 |
| 17 |
|
CH | 0.395 ± 0.14 | >50 |
| 18 |
|
N | 0.147 ± 0.07 | >50 |
| 19 |
|
CH | 0.059 ± 0.016 | >15 |
| 1 (NT160) |
|
CH | 0.046 ±0.015 | >15 |