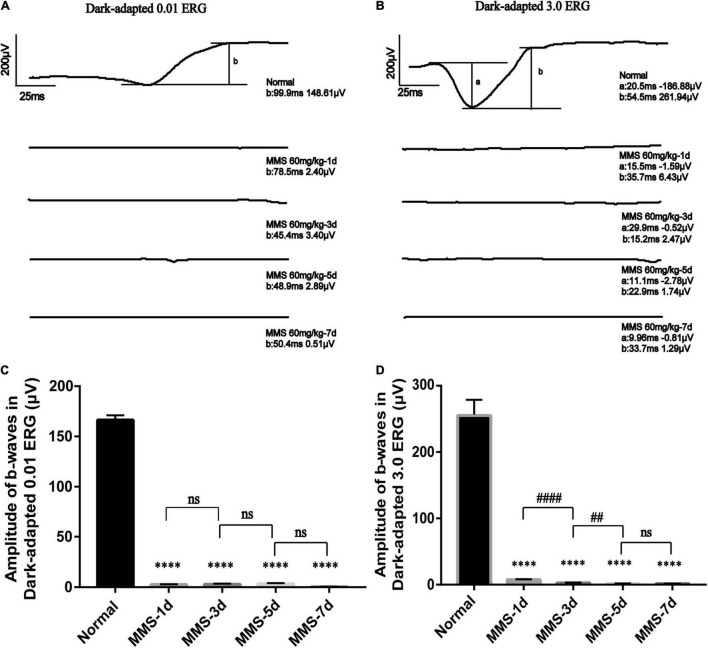
FIGURE 2.
The retinal function deteriorates with time after tail vein injection of MMS. (A) The b-wave of Dark-adapted 0.01 electroretinogram (ERG) of normal retina without MMS treatment and retina after MMS administration (1, 3, 5, and 7 days). (B) The b-wave of Dark-adapted 3.0 ERG of normal retina without MMS treatment and retina after MMS administration (1, 3, 5, and 7 days). (C) The histogram of the amplitude of b-wave of Dark-adapted 0.01 ERG. One way ANOVA multiple comparisons was analyzed, ∗∗∗∗P < 0.0001 for differences compared with controls, n = 3. (D) The histogram of the amplitude of b-wave of Dark-adapted 3.0 ERG. One way ANOVA multiple comparisons was analyzed, ∗∗∗∗P < 0.0001 for differences compared with controls; ####P < 0.0001, ##P < 0.01 for differences compared with previous time point group, n = 3.

