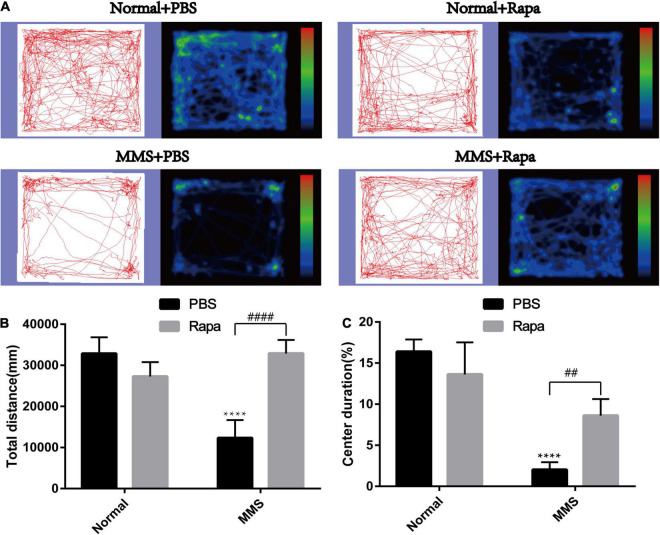
FIGURE 8.
Effect of rapamycin on the behavioral changes of mice in open field at 5 days after tail vein injection of MMS. (A) Trajectories and density maps of mice in four groups: Normal + PBS, Normal + Rapa, MMS + PBS, MMS + Rapa. (B) The histogram of the total distance of the mice. Two way ANOVA was analyzed, ****P < 0.0001 for difference between MMS + PBS and Normal + PBS, ####P < 0.0001 for difference between MMS + Rapa and MMS + PBS, n = 6. (C) The histogram of the percentage of center duration of mice. Two way ANOVA was analyzed, ****P < 0.0001 for difference between MMS + PBS and Normal + PBS, ##P < 0.01 for difference between MMS + Rapa and MMS + PBS, n = 6/group.

