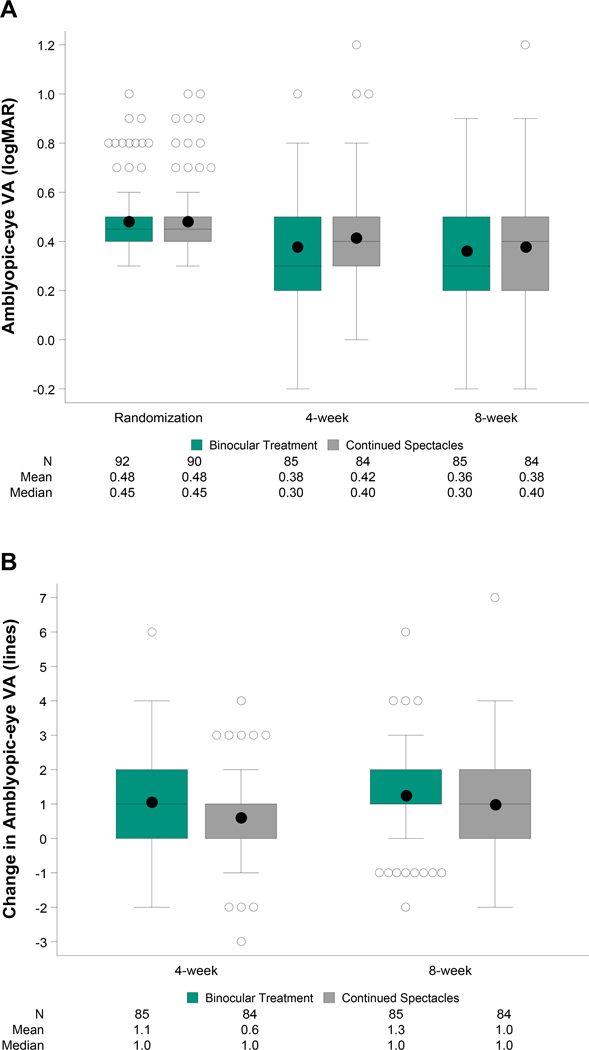
Figure 2.
(A) Amblyopic-eye visual acuity at randomization (baseline) and outcome visits by treatment group. At each time point, the left box represents the binocular treatment group and the right box represents the continued spectacles group. Bottom and top of each box represent the 25th and 75th percentiles; the line in the box is the median and the dot is the mean. Bars above and below extend to the closest observed data point inside 1.5 times the interquartile range and open circles represent statistical outliers. Analyses were limited to 4-week (21 to <49 days after randomization) and 8-week (49 to <105 days after randomization) exams completed within the pre-defined analysis windows.(B) Change in amblyopic-eye visual acuity from baseline to outcome visits by treatment group. At each time point, the left box represents the binocular treatment group and the right box represents the continued spectacles group. Bottom and top of each box represent the 25th and 75th percentiles; the line in the box is the median and the dot is the mean. Bars above and below extend to the closest observed data point inside 1.5 times the interquartile range and open circles represent statistical outliers. Analyses were limited to 4-week (21 to <49 days after randomization) and 8-week (49 to <105 days after randomization) exams completed within the pre-defined analysis windows.

