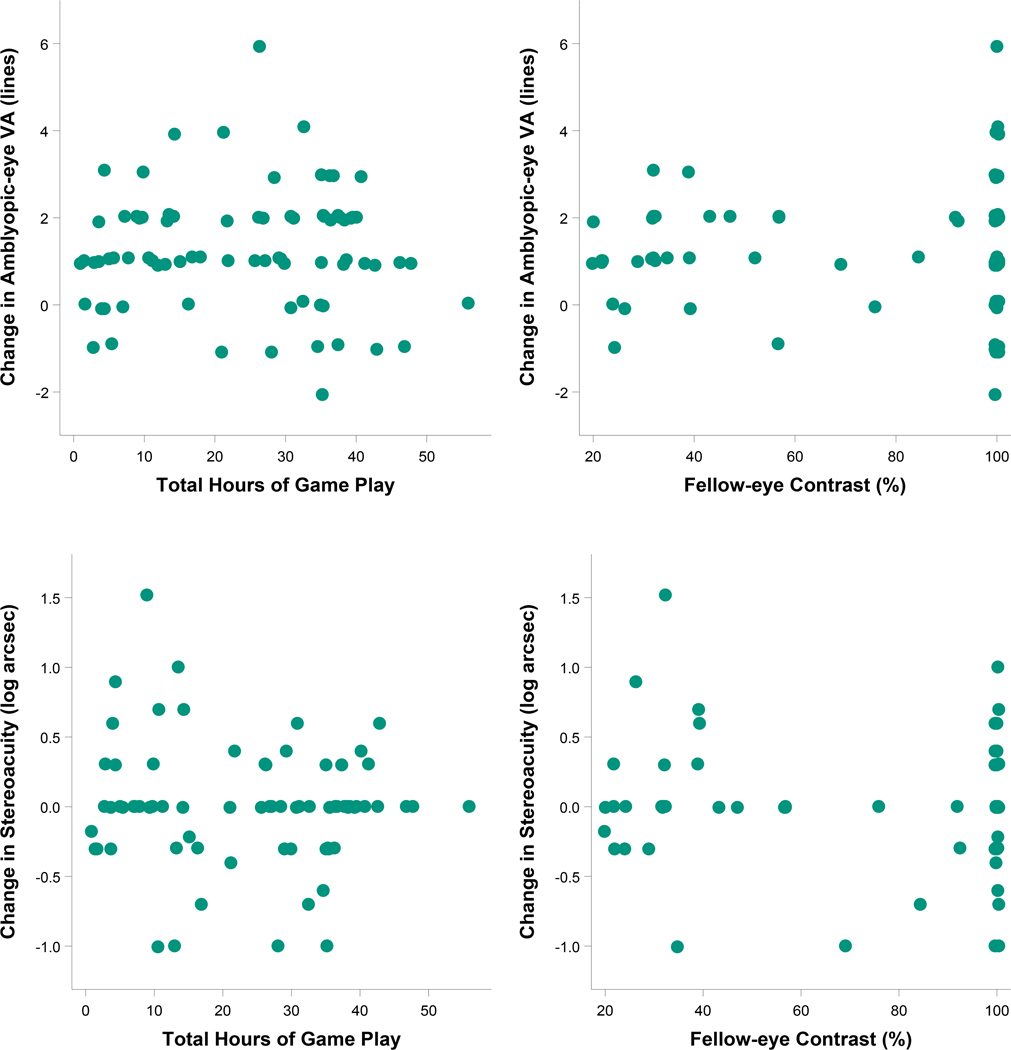
Figure 5.
Relationships of hours played and contrast settings (from the log file) with treatment response for visual acuity and stereoacuity after 8 weeks of binocular therapy (binocular treatment group). Descriptive plots and Pearson correlation coefficients were produced using 8-week data from participants in the binocular treatment group who completed the visit within the pre-defined analysis window (49 to <105 days after randomization). The scatterplots on the top represent the relationships of change in amblyopic-eye visual acuity from baseline (logMAR lines, positive values indicate improvement) with objective measures of (1) total hours of binocular treatment [left column, r (95% CI) = −0.002 (−0.22 to 0.22)] and (2) contrast presented to the fellow eye [right column, r (95% CI) = 0.05 (−0.17 to 0.26)]. The scatterplots on the bottom represent the relationships of change in stereoacuity from baseline (log seconds of arc, positive values indicate improvement) with objective measures of (1) total hours of binocular treatment [left column, r (95% CI) = −0.08 (−0.30 to 0.15)] and (2) contrast presented to the fellow eye [right column, r (95% CI) = −0.11 (−0.33 to 0.12)].

