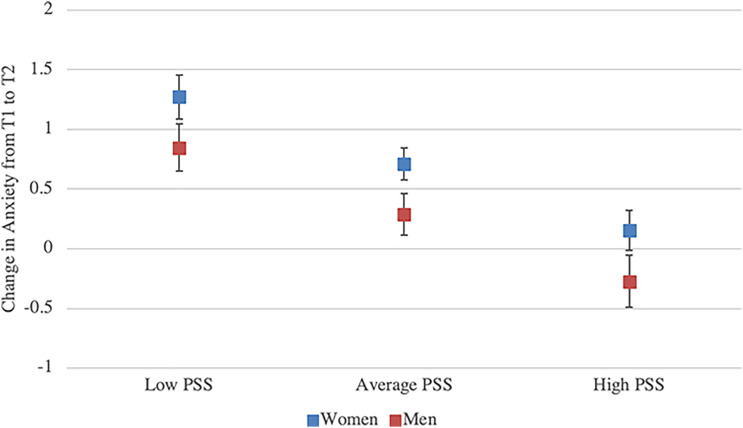
Figure 1.
Change in Anxiety from T1 to T2 by Level of Pre-Pandemic Perceived Stress and Gender. Note. This figure represents the predicted change in PHQ-4 anxiety scores from T1 (pre-) to T2 (during-COVID-19) resulting from the analyzed moderation model (see Table 4). Data points represent the estimated change in anxiety at low, average, and high levels of T1 perceived stress (PSS) accounting for academic problems, loneliness, and positive perceptions at their means. At the PSS average, the estimated increase is represented by the constant (.28). Women’s scores reflect greater change from T1 to T2 due to the main effect of gender (.43). Low and high PSS scores represent one standard deviation from the mean. 95% confidence intervals are indicated with error bars.

