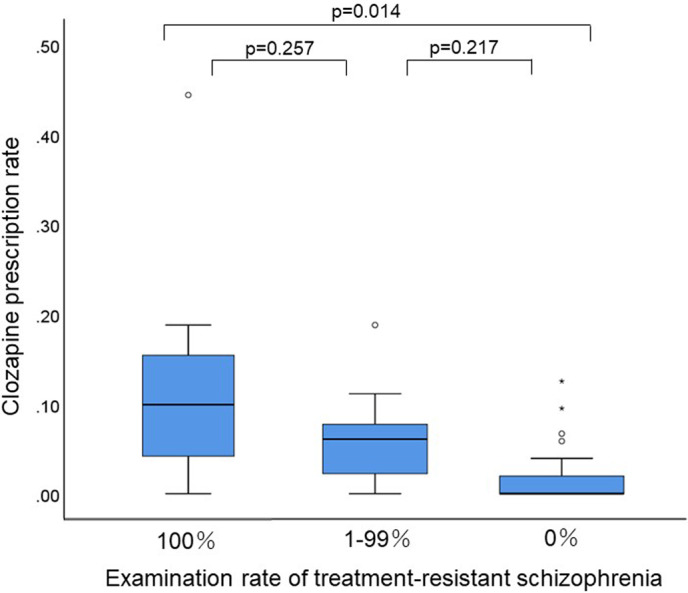
FIGURE 3.

Clozapine prescription rates among the 3 facility groups, classified based on treatment‐resistant schizophrenia examination rates. This box‐and‐whisker plot shows the distribution of clozapine prescription rates. The centerline of the box shows the median, and the top and bottom sides of the box show the quartile ranges. Error bars indicate the maximum and minimum values. Outliers are plotted as points because the beard length only extends to 1.5 times the quartile range
