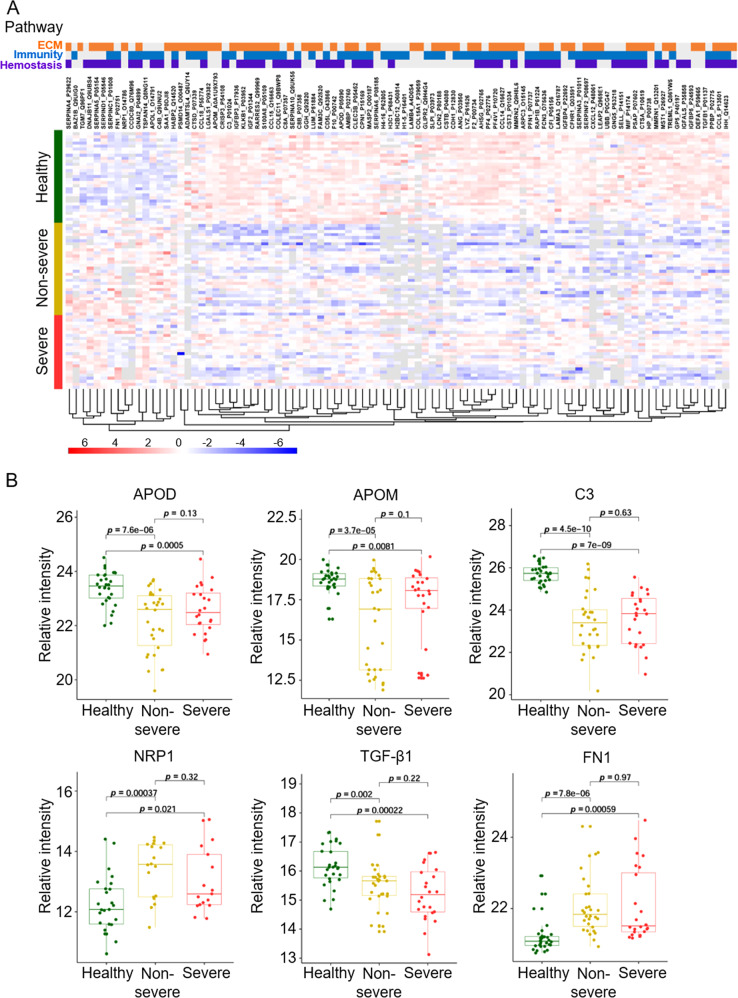
Fig. 2. Proteomic profiling of plasma samples obtained from COVID-19 survivors 6 months after discharge and healthy control subjects.
A Heatmap visualization of significantly differentially expressed proteins (DEPs) whose regulation concentrated on three enriched pathways. The graphs show the relative intensity of DEPs. Proteins included in the heatmap meet the requirement that fold-change >1.5 or <0.67 and p value (t test) of <0.05. p values were then adjusted using the Benjamini-Hochberg correction (false discovery rate, <0.05). The color bar represents the relative intensity of identified proteins from −6 to 6. B The boxplots show six proteins, which are significantly different between COVID-19 survivors 6 months after discharge and healthy control subjects. Healthy group, n = 30; non-severe group, n = 30; severe group, n = 24. APOD apolipoprotein D; APOM apolipoprotein M; C3 complement 3; FN1 fibronectin 1; NRP1 Neuropilin-1; TGFβ1 transforming growth factor beta 1.

