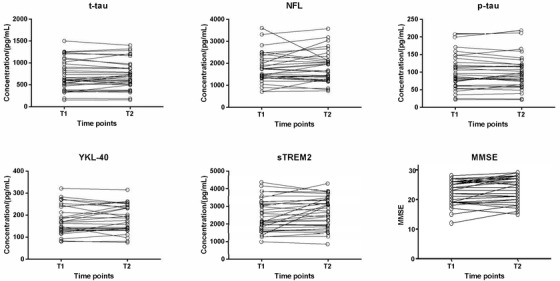
FIGURE 2.

Individual changes in t‐tau, NfL, p‐tau, YKL‐40, and sTREM2 concentrations and MMSE scores between day 0 (T1) and day 28 (T2) of the intervention. MMSE, Mini‐Mental State Examination; NfL, neurofilament light chain; p‐tau, phosphorylated tau; sTREM2, soluble triggering receptor expressed on myeloid cells 2; t‐tau, total tau.
