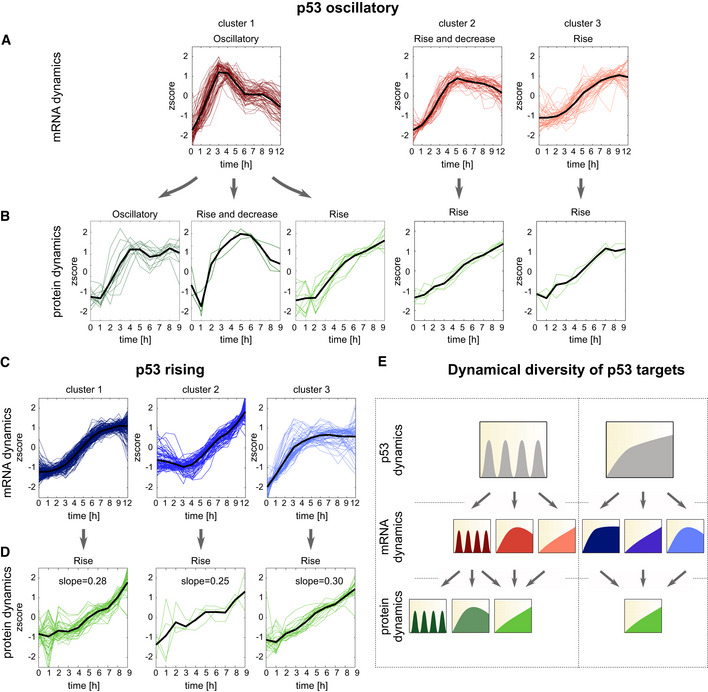
Figure 2. Oscillatory p53 leads to greater diversity of both mRNA and protein dynamic profiles compared to rising p53.

-
A–DInduced p53 targets were subjected to fuzzy c‐means clustering according to their mRNA expression profiles under (A) oscillatory or (C) rising p53 expression. Differential mRNA expression was defined as fold change > 1.5 and FDR < 0.2 (t test, Benjamini–Hochberg corrected) based on two independent experiments. mRNAs were clustered based on their normalized time traces (z score) into five expression clusters under oscillatory or rising p53. Only upregulated clusters are shown. (B, D) The proteins corresponding to the mRNAs in each group were clustered according to their expression profiles. Differential protein expression was defined as fold change > 1.15 and FDR < 0.2 (t‐test, Benjamini–Hochberg corrected) based on two independent experiments. The mean expression of each cluster is shown in black.
-
ESchematic showing all observed mRNA and protein dynamics under each p53 dynamical condition.
