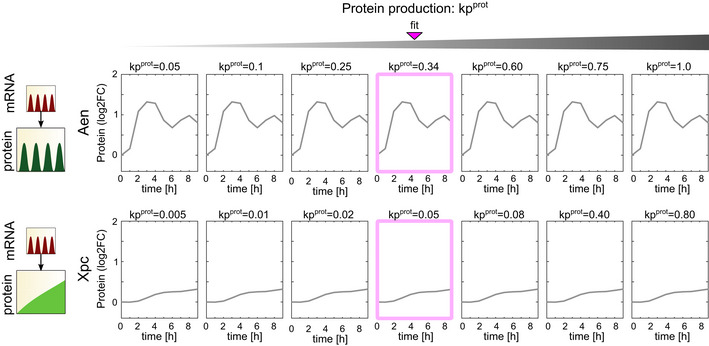
Figure EV3. Predicted protein expression trajectories of two representative p53 target genes for different values of kpprot .

Protein expression trajectories for targets showing the mRNA and protein dynamics indicated at the left were modeled for the indicated values of kpprot (with kdprot fixed at the value determined in Fig 3C). Pink box shows the value of kpprot that best fits the experimentally measured protein levels.
