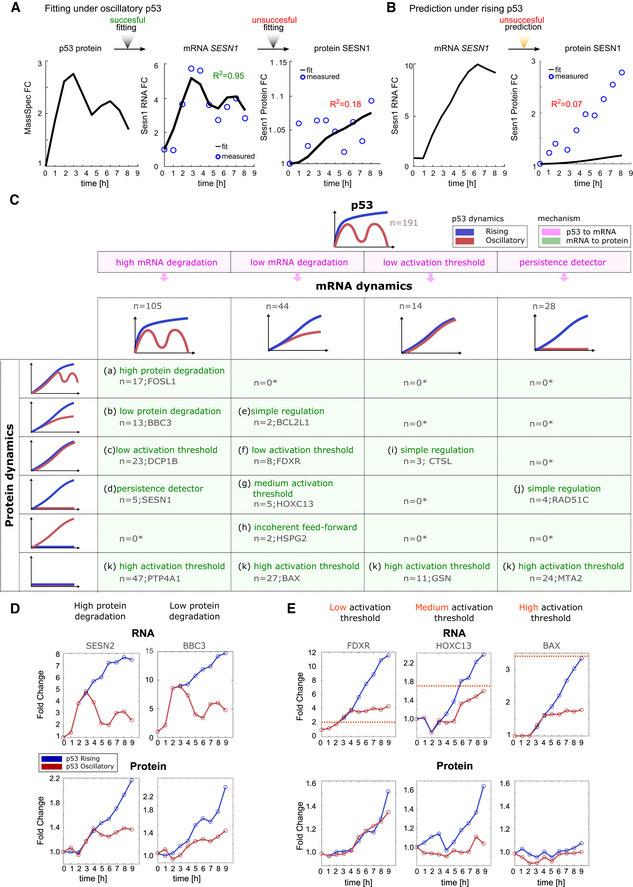
Figure 4. Classification of mRNA and protein dynamics suggests distinct mechanisms to decode p53 dynamics.

- mRNA and protein production and degradation rates for SESN1 under oscillatory p53 dynamics were fit as described in Fig 3A.
- mRNA and protein production and degradation rates for SESN1 fitted under oscillatory dynamics were used to predict SESN1 protein expression under rising dynamics.
- Table showing all combinations of mRNA and protein responses of 191 genes with complete mRNA and protein measurements under both oscillatory and rising p53 dynamics. Combinations are classified into 11 different categories (a–k). An asterisk represents categories which cannot be achieved without additional complex feedback mechanisms independent of p53 dynamics. Target examples are given. Pink background represents transcriptional mechanisms while green background represents post‐transcriptional mechanisms for observed dynamics.
- Two targets with similar mRNA expression profiles but high (SESN2, category a) or low (BBC3, category b) protein degradation rates are shown.
- Examples of targets showing similar mRNA profiles but distinct protein responses resulting from distinct activation thresholds (dotted pink lines represent hypothetical threshold): low (FDXR), medium (HOXC13), and high (BAX).
