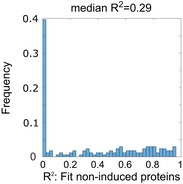
Figure EV4. Distribution of R 2 values for the fitting of expression of p53 target proteins not induced under oscillatory conditions.

All proteins that were detectable but not induced under oscillatory p53 were fit for kpprot and kdprot based on mass spectrometry data collected under oscillatory conditions. The distribution of R 2 values for these fits is shown.
