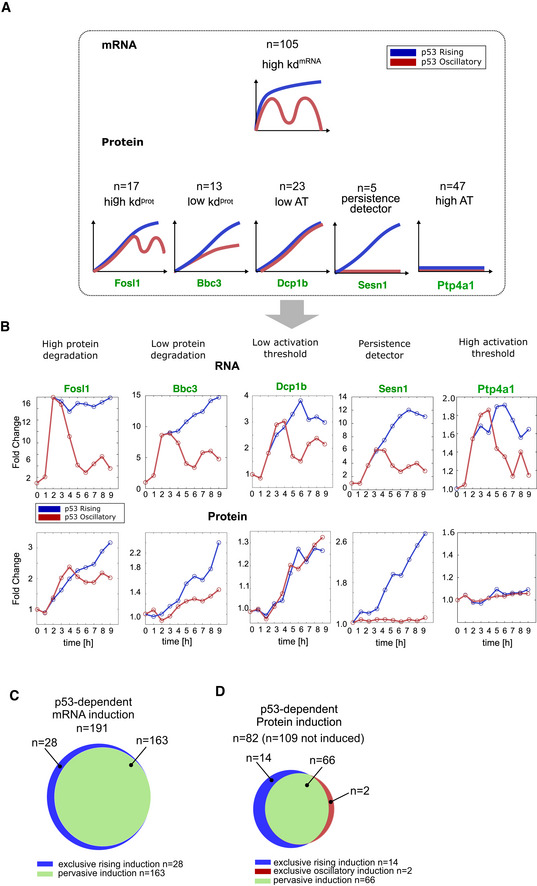
Figure EV5. Expanded view of mechanisms decoding p53 dynamics.

-
ASchematics showing relationship between dynamical mRNA and protein responses for oscillatory mRNA.
-
BFour targets with similar mRNA expression profiles—high mRNA degradation rate—but distinct protein profiles due to differences in protein degradation rates, activation thresholds (AT), or existence of cFFLs are shown.
-
C, DVenn diagrams showing exclusive or pervasive induction of mRNA and protein. Fifteen percent of mRNA (28/191 = 15%) and 20% (16/82 = 20%) of proteins show exclusive induction. A total of 109 of the 191 mRNAs in (C) failed to induce proteins under either p53 dynamic.
