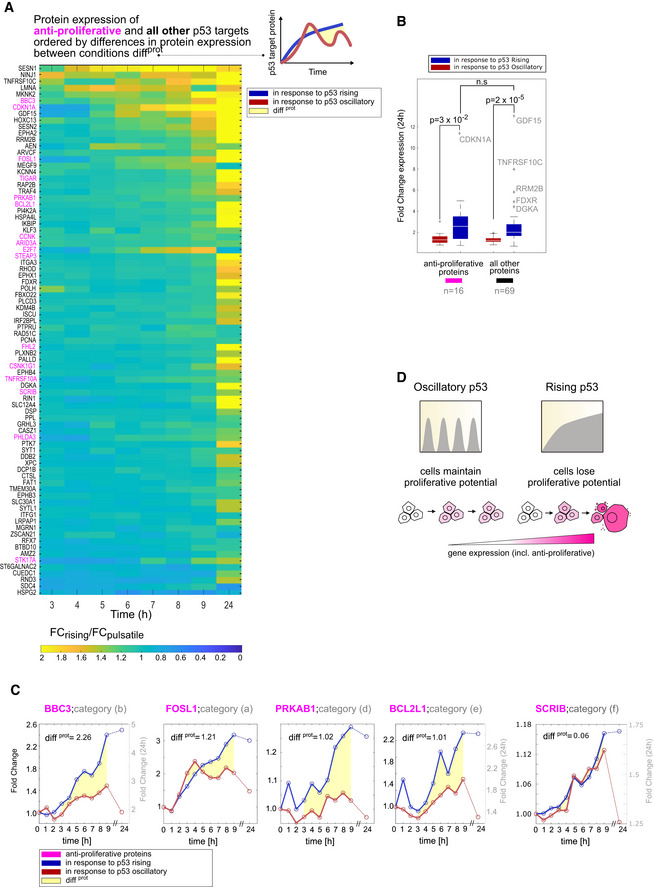
Figure 6. Rising p53 globally enhances the expression of genes in multiple classes.

- Heatmap of genes ordered based on their differences in protein expression diffprot between oscillatory and rising p53 (see Materials and Methods and diagram at right). Anti‐proliferative targets (those involved in apoptosis, cell cycle arrest, or senescence) are shown in pink.
- Boxplots showing fold changes in protein expression of anti‐proliferative proteins or all other proteins under oscillatory or rising p53 dynamics at 24 h. Central box shows median with box edges and whiskers extending to the 25–75 and 5–95% quantiles, respectively. Individual dots represent outliers. P‐values were calculated using a two‐sided t‐test. N.s., not significant.
- Examples of apoptotic proteins whose expression profiles fall into five distinct dynamical categories (Fig 4C, categories a, b, d, e, f). Yellow area represents differences in protein expression diffprot between p53 dynamical conditions (see Materials and Methods).
- Enhanced expression of anti‐proliferative genes can lead to irreversible outcomes.
