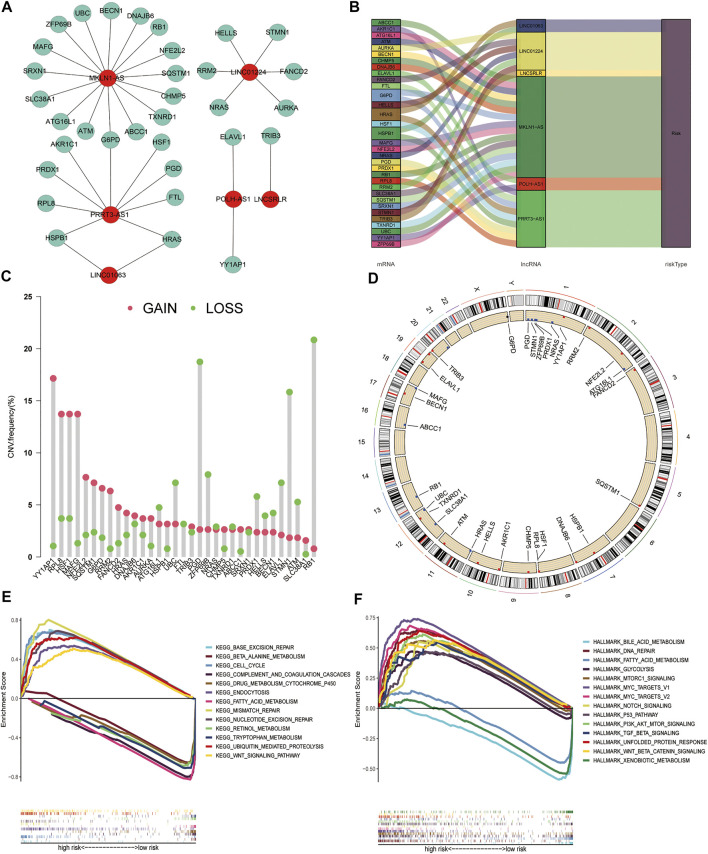
FIGURE 10.
Construction of the co-expression network, copy number variations of ferroptosis genes associated with the signature, and Gene set enrichment analysis. (A) The Sankey plot shows the degree of association between the FR-lncRNAs and FRGs. (B) Diagram of the co-expression network. (C) The CNV frequency of FRGs associated with the signature. (D) The location of CNV changes of FRGs on chromosomes. (E) KEGG. (F) Hallmark gene set. (p < 0.05).

