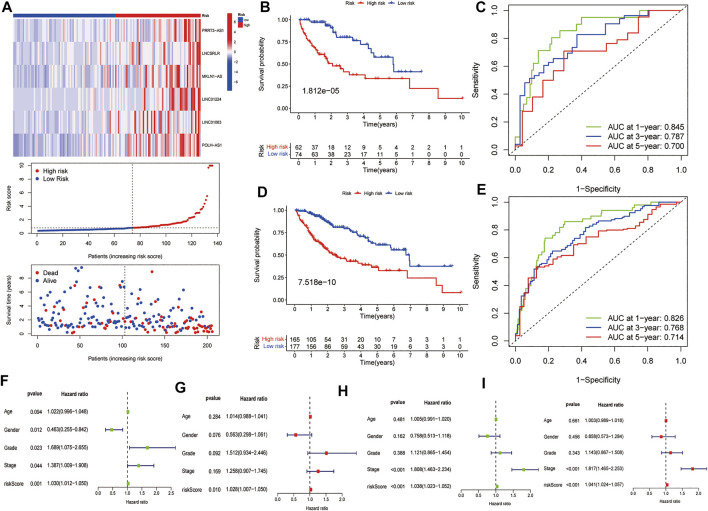
FIGURE 4.
Further validation of the model in the testing group and the entire cohort. (A) The heatmap of the expression of six FR-lncRNAs, risk scores, and scattergram of every patient, (B) K–M curves for the OS and (C) ROC analysis of the 1, 3, and 5 years OS of HCC patients in the testing group. (D) K–M curves for the OS and (E) ROC curves of the 1, 3, and 5 years OS of HCC patients in the entire group. The (F) univariate and (G) multivariate Cox regression results in the testing group. The (H) univariate and (I) multivariate Cox regression results in the entire group.

