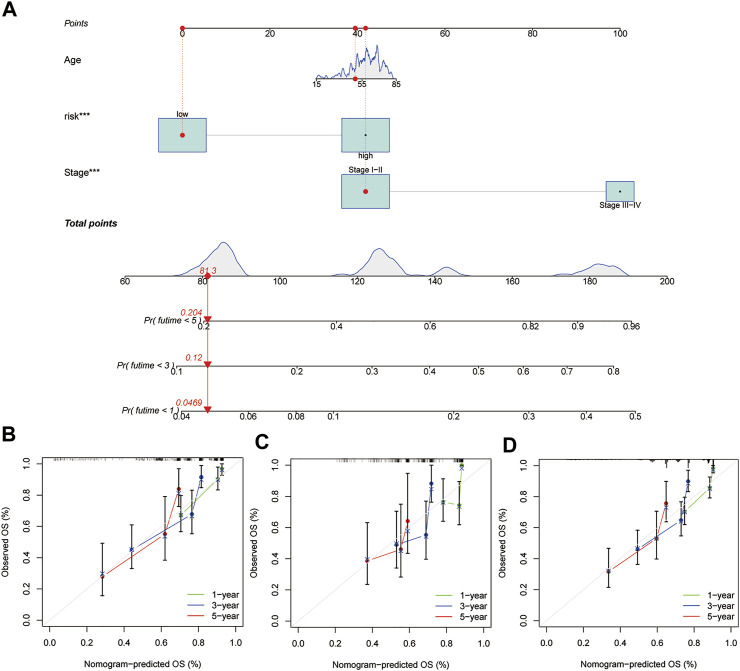
FIGURE 6.
Construction of a nomogram in the training group and calibration maps were used to predict the 1-year, 3-years, and 5-years survival. (A) Nomogram constructed using the training group dataset. Assessing the accuracy of the nomogram using calibration maps in the (B) training group, (C) testing group, and (D) entire group.

