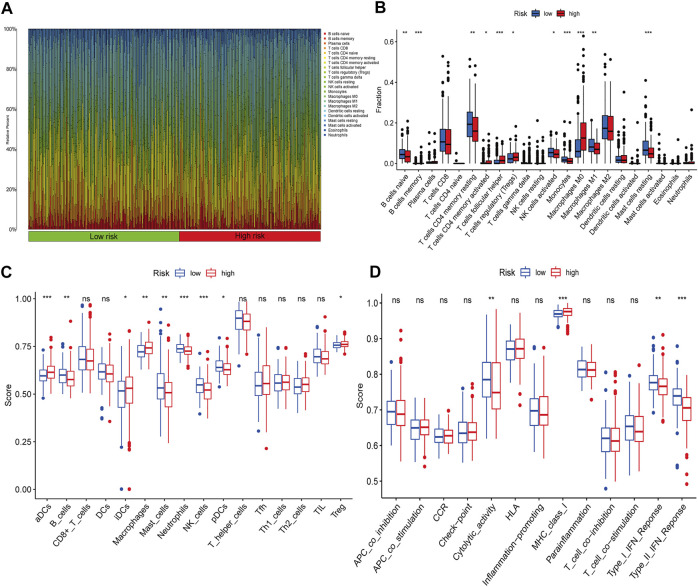
FIGURE 7.
Immune profiles between different risk groups. (A) Relative proportions of immune cells in HCC patients. (B) Comparison of immune cell subtypes in the high- and low-risk groups. ssGSEA results show the differences in (C) immune cell infiltration and (D) immune function between the two groups.

