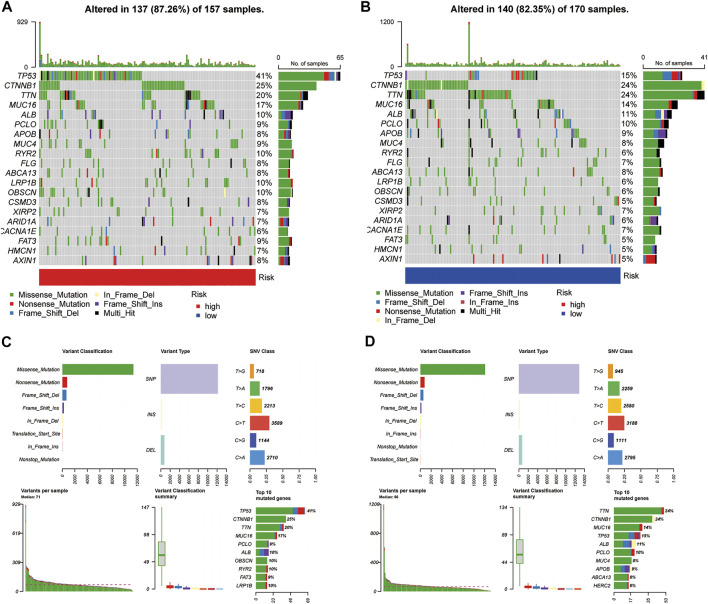
FIGURE 9.
Somatic mutation analysis. (A,B) Oncoplots of the mutated genes in the (A) high-risk and (B) low-risk groups. [(C,D), above] Missense mutations, SNPs, and C > T mutations were the most common mutation types in both groups. [(C,D), below] Variants per sample, variant classification summary, and top ten mutated genes.

