Figure 4.

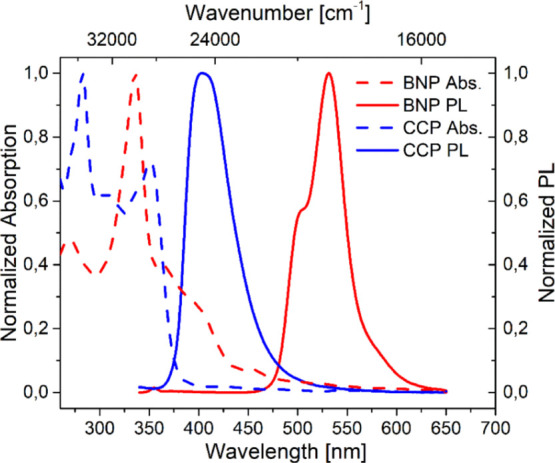
Normalized absorption (dashed lines) and emission (continuous lines) spectra of BNP (red) and CCP (blue) measured in DCM at c ∼ 1 × 10⁻³ mg mL–1. The excitation wavelengths were λex = 300 nm (CCP) and λex = 330 nm (BNP).

Normalized absorption (dashed lines) and emission (continuous lines) spectra of BNP (red) and CCP (blue) measured in DCM at c ∼ 1 × 10⁻³ mg mL–1. The excitation wavelengths were λex = 300 nm (CCP) and λex = 330 nm (BNP).