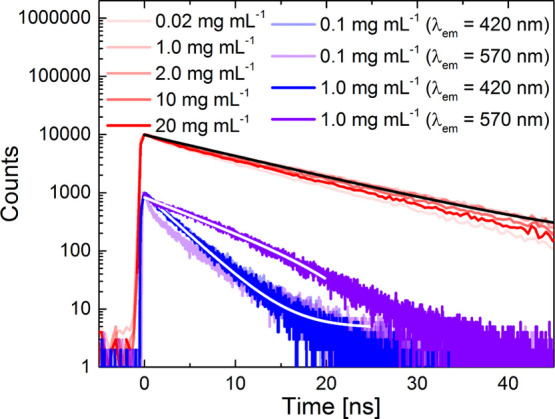
Figure 7.

TCSPC measurements of BNP (red, λex = 355 nm and λem = 530 nm) and CCP (blue and violet tones, λex = 371 nm and λem = 420 and 570 nm) in DCM solutions and regarding lifetime fittings (black/white lines). The dynamic range of the measurements was 103 (CCP) and 104 (BNP), which explains the different onset values of the respective curves.
