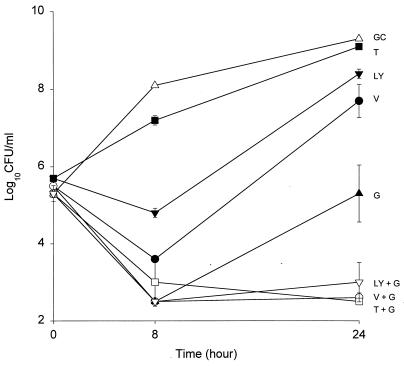
FIG. 3.
Time-kill curves of growth control curve (GC) (▵); time-kill curves of vancomycin (V) (●), teicoplanin (T) (■), LY333328 (LY) (▾), and gentamicin (G) (▴) alone; and time-kill curves of LY + G (▿), V + G (○), and T + G (□) in combination versus S. aureus HIP5836 at one-half times the MIC. Error bars indicate standard deviations.

