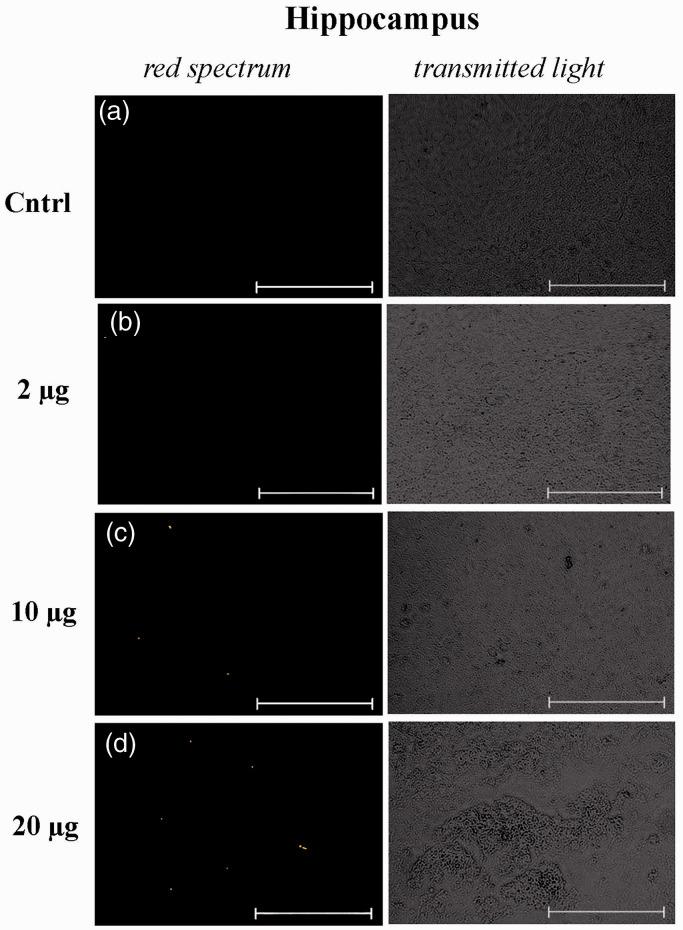
Figure 3.
Micrographs of cytological smears of the hippocampus of control NMRI mice, which were injected with solutions with unstained mitochondria at a dose of 10 μg per mouse (negative control) (a) and MTR-stained mitochondria at doses of 2 μg (b), 10 μg (c), and 20 μg (d) per mouse. Representative images in the red spectral region (left panel) and in the transmitted light (right panel) are presented (n = 3). The scale bar: 50 μm. (A color version of this figure is available in the online journal.)

