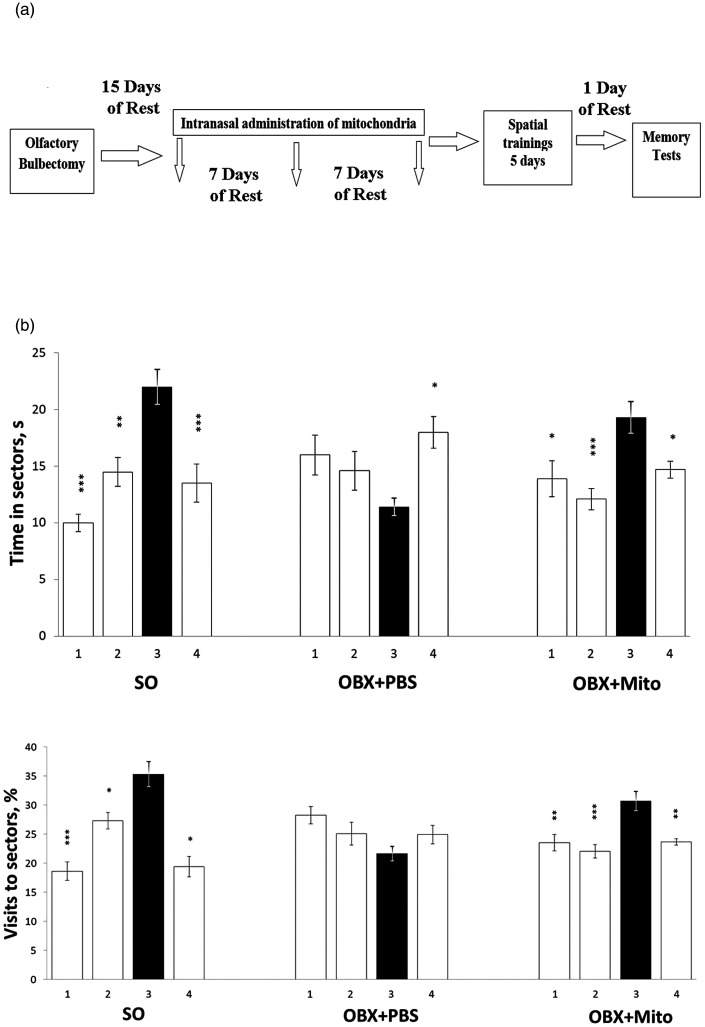
Figure 5.
Scheme of the experiment (a) and the effect of intranasal administration of brain mitochondria (20 μg/mouse) on the indicators of spatial memory of sham-operated (SO), olfactory bulbectomized (OBX+PBS), and mitochondria-treated OBX (OBX+Mito) mice (b). The shaded bars correspond to the parameters in the target third sector. 1–4 – the sector numbers of the Morris water maze. Statistically significant differences between the groups were identified by the Tukey's HSD analysis: *p < 0.05; **p < 0.01; ***p < 0.001 (n = 5).

