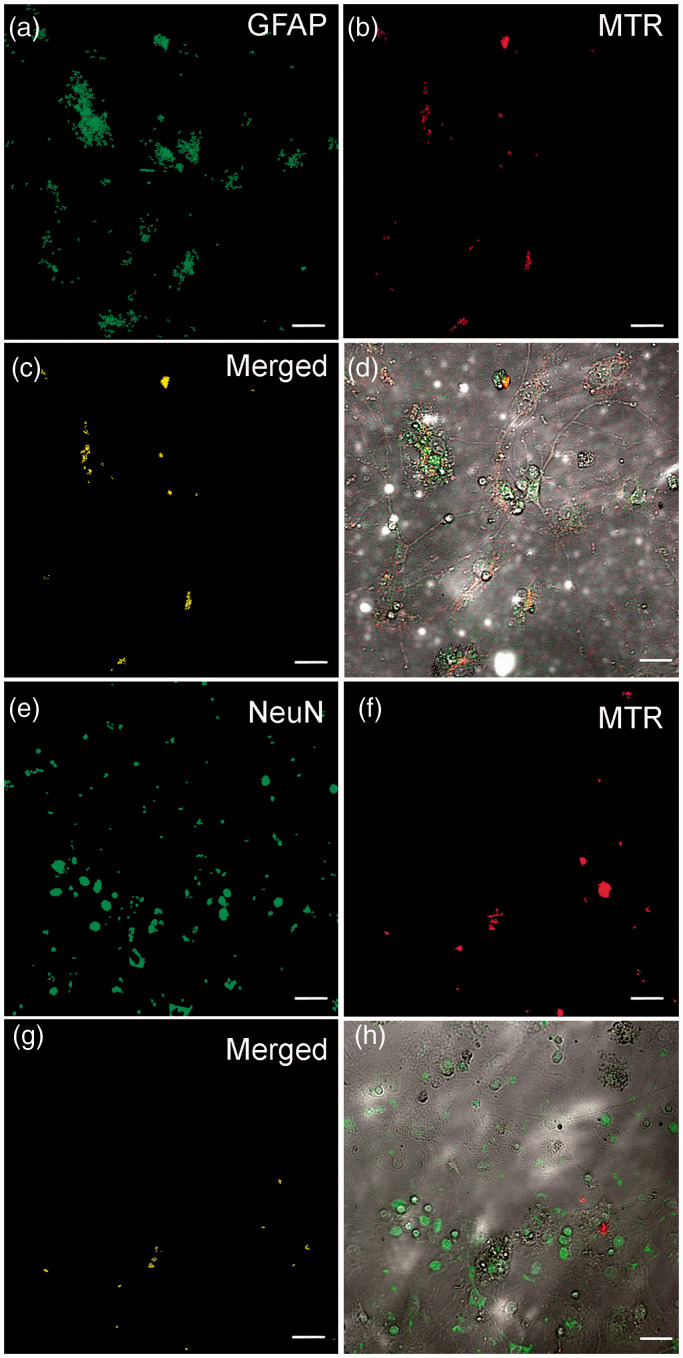
Figure 6.
Identification of MTR-labeled allogenic mitochondria in astrocytes (a–d) and neurons (e–h) of NMRI mouse hippocampal cell culture. Co-staining GFAP (marker for astrocytes, green) or NeuN (marker for neurons, green) with MitoTracker Red (MTR)-labeled mitochondria (red). (c and g) The merged images of binary masks of AF488 anti-GFAP (or DL488 anti-NeuN) and MTR channels. (d and h) The merged images of transmitted light, AF488 anti-GFAP (or DL488 anti-NeuN), and MTR channels. The scale bar: 25 μm. (A color version of this figure is available in the online journal.)

