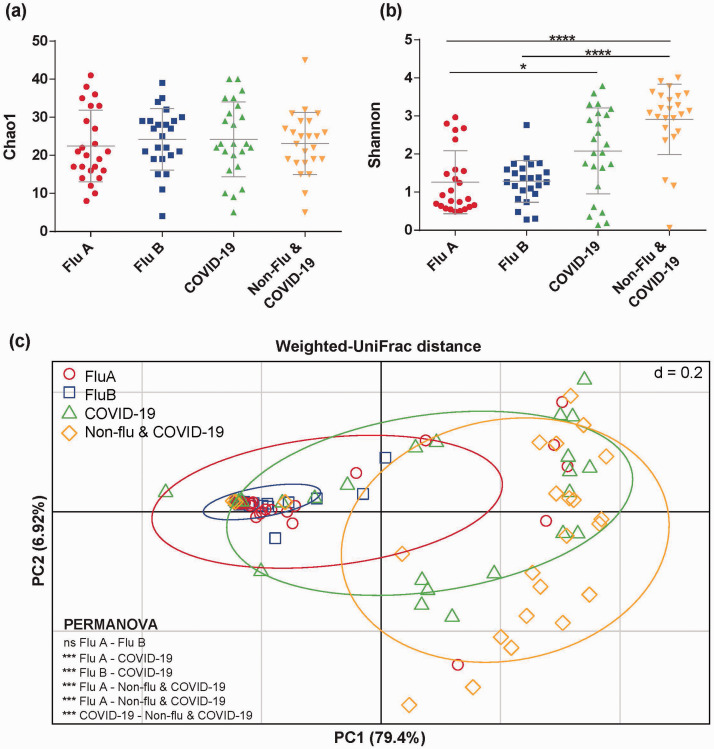
Figure 1.
The comparison of the bacterial diversities in Flu A, Flu B, COVID-19, and Non-flu & COVID-19 patients. The bars indicate average diversity of (a) Chao1 richness and (b) Shannon diversity index with standard deviation and significant differences among four groups. (c) Principal-coordinate analysis (PCoA) of the specific microbial communities weighted UniFrac distance colored by sample groups shows the significant difference between groups (tested by PERMANOVA analysis with P < 0.05). *P < 0.05, ***P < 0.001, ****P < 0.0001 and ns (not significant). (A color version of this figure is available in the online journal.)

