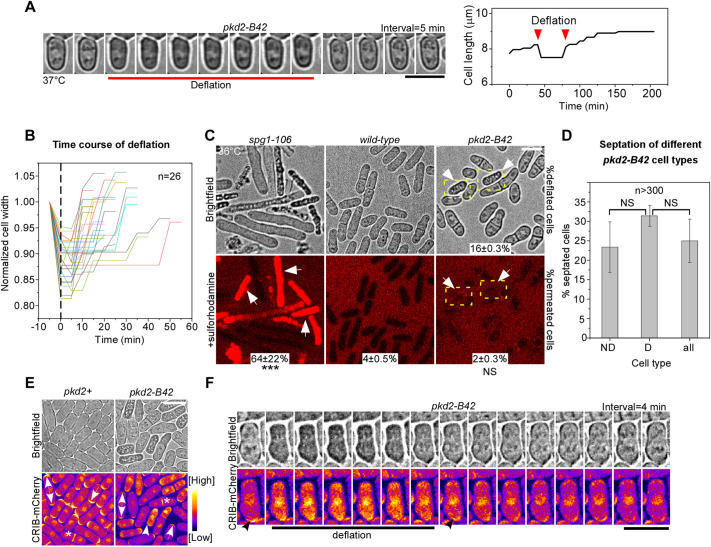
Fig. 2.
Deflation of pkd2-B42 cells. (A) Deflation of a pkd2-B42 cell at 37°C. Left: time-lapse micrographs. Right: time course of the cell length. (B) Time course of normalized width of 26 pkd2-B42 mutant cells during deflation followed by recovery. Dashed line indicates when the cells started shrinking. (C) Brightfield (top) and fluorescence (bottom) micrographs showing live cells of the indicated strains stained with SRB to visualize lysed cells. Arrows, deflated pkd2-B42 cells. Dashed boxes indicate deflated cells. The percentage of SRB-stained cells (mean±s.d. of two experiments, n>400) is shown for each strain. (D) Percentage of septated cells among the non-deflated (ND), deflated (D) and all pkd2-B42 cells at 36°C. n>300 cells in total. Data are presented as the mean±s.d. of three experiments. (E,F) Polarity in deflated pkd2-B42 cells. (E) Brightfield (top) and fluorescence (bottom) micrographs of wild-type (pkd2+) and pkd2-B42 cells expressing CRIB–mCherry at 36°C. Single-headed arrow, monopolar cell; double-headed arrow, bipolar cell; asterisk, dividing cell; arrowhead, deflated cell with mislocalized CRIB–mCherry. (F) Time-lapse micrographs of a pkd2-B42 mutant cell expressing CRIB–mCherry, taken at 4 min intervals. Data are representative of least two independent biological repeats. Scale bars: 10 µm. ***P<0.001; NS, not significant (two-tailed unpaired Student’s t-test).

