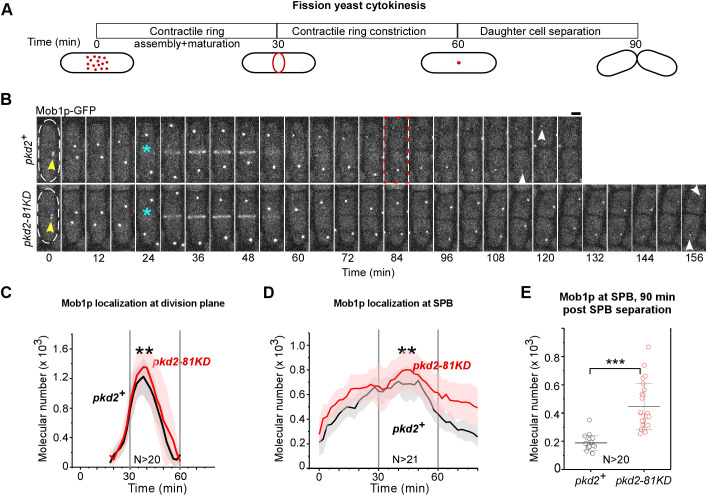
Fig. 7.
Localization of SIN proteins in pkd2-81KD cells. (A) Schematic of the average time course of fission yeast cytokinesis. Time zero denotes the separation of SPBs during prometaphase. (B) Time-lapse micrographs of either a wild-type (pkd2+, top) or pkd2-81KD (bottom) cell expressing Mob1p–GFP. Time is shown as minutes after SPB separation; time interval, 6 min. Cell outlines are marked with dashed lines at time zero. Arrowheads, SPBs; asterisks, appearance of Mob1p–GFP at the division plane. The red dashed box indicates cell separation. Scale bar: 2 μm. (C,D) Mean time courses of the number of Mob1p–GFP molecules at either the division plane (C) or SPBs (D) of either wild-type (black line) or pkd2-81KD cells (red line). Shaded regions represent the s.d. The three stages of cytokinesis are separated by vertical lines. P-values were calculated by comparing the peak numbers of Mob1p–GFP molecules in either the ring or SPBs. (E) Dot plot of the number of Mob1p–GFP molecules at the SPB 90 min after SPB separation. Data are presented as the mean±s.d. The data were pooled from two independent biological repeats. **P<0.01; ***P<0.001 (two-tailed unpaired Student's t-test).

