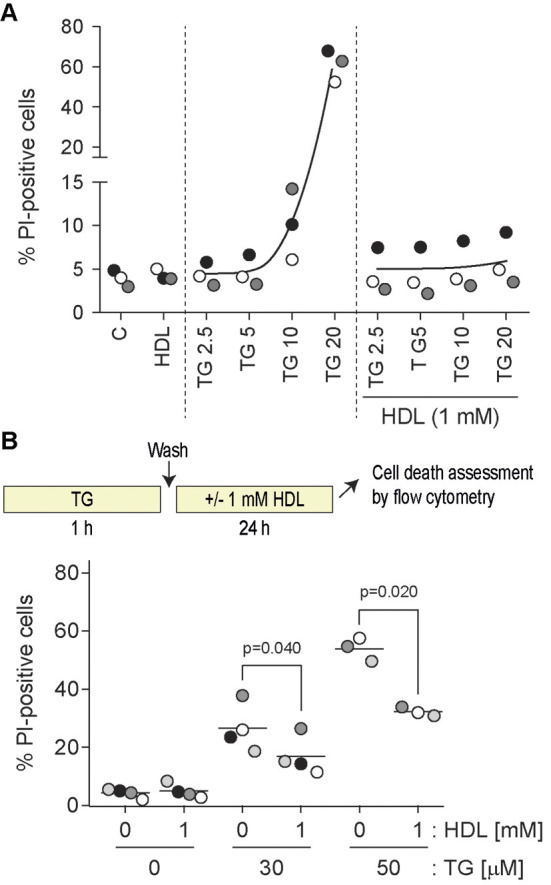
Fig. 1.

HDL-mediated inhibition of TG-induced cell death. (A) DLD-1 cells were seeded in six-well plates (100,000 per well). After 24 h, cells were treated for 48 h with the indicated concentrations (in µM) of TG in the presence or in the absence of HDLs. Cell death was measured by flow cytometry following PI staining. Symbols with a given shade of gray are derived from a given independent experiment. The black curves go through the average values of the different experiments. (B) DLD-1 cells were seeded in six-well plates (100,000 per well). After 24 h, cells were pre-treated 1 h with the indicated concentrations of TG (in µM). Cells were washed once with PBS and then incubated or not with 1 mM HDLs for an additional 24 h period at which time cell death was assessed by PI incorporation using flow cytometry. P-values were calculated using a one-way ANOVA with a post-hoc Dunnett's multiple comparison test.
