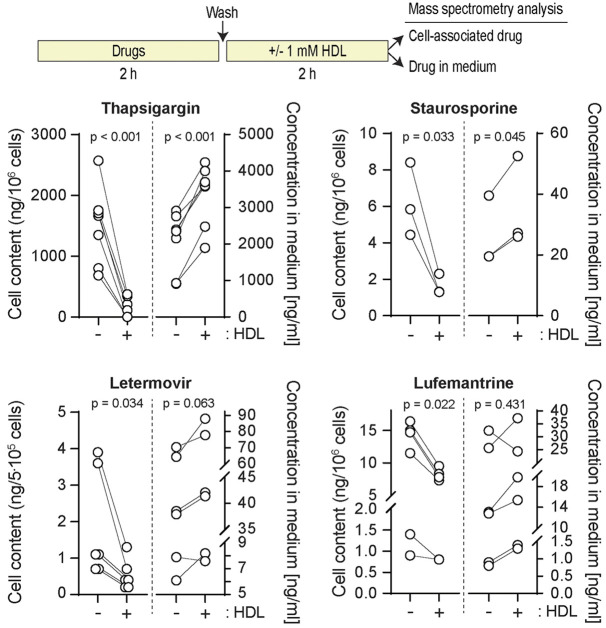
Fig. 4.
HDLs extract hydrophobic drugs from cells. DLD1 cells (500,000 cells) plated in six-well plates were treated 24 h later as depicted in the scheme above the figure (also see Materials and Methods) using the following concentrations: thapsigargin, 20 µM; staurosporine, 100 nM; letermovir and lumefantrine, 1 µg/ml. The cell-associated drug content and the drug found in the medium were then quantitated as described in the Materials and Methods. The data correspond to 4–7 replicates coming from two or three independent experiments. For the letermovir and lufemantrine graph, two independent experiments (two replicates each) were performed several weeks apart using the same drug stocks. Drug degradation may account for the lower signal obtained for the last two replicates. P-values were calculated with a two-tailed paired t-test.

