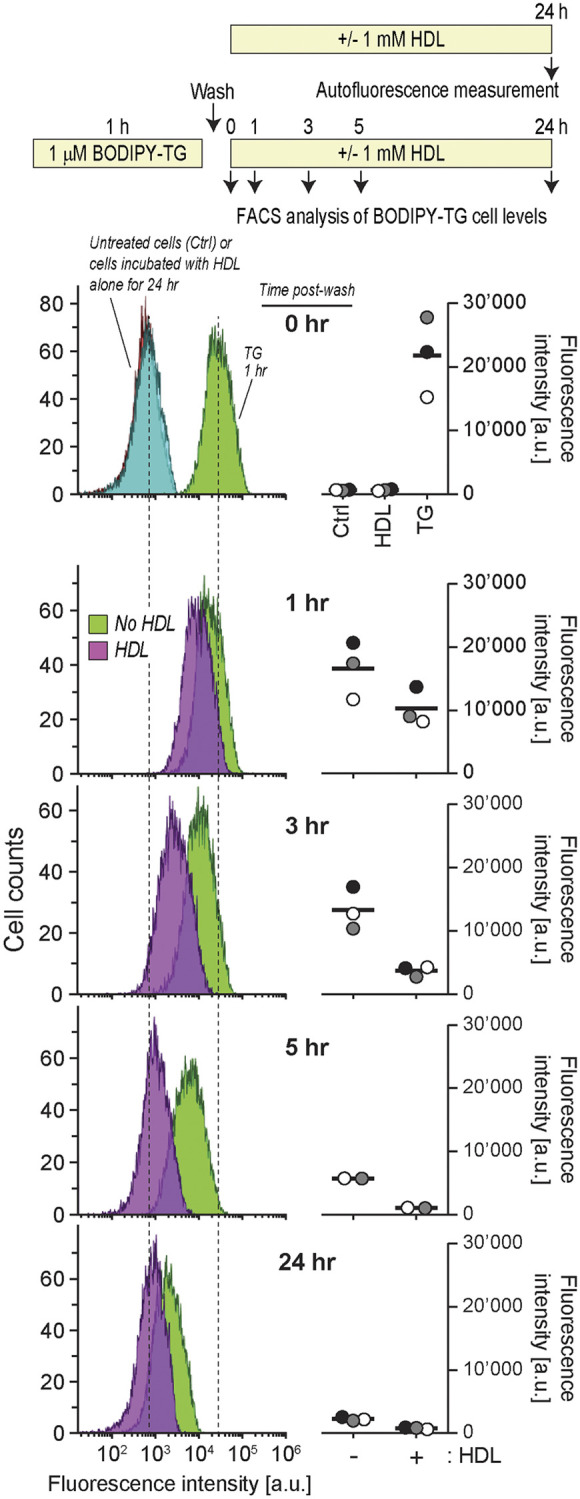
Fig. 5.

Kinetics of spontaneous and HDL-mediated TG cell release. Min6 cells (300,000 cells per well) were seeded in six-well plates and cultured overnight. After treatment with 1 μM BODIPY–TG for 1 h, cells were washed with PBS once and then incubated with medium or HDLs for the indicated periods of time before their drug content was analyzed by flow cytometry. In the ‘0 hr’ panel, the autofluorescence of untreated cells and cells incubated with HDLs alone for 24 h are also shown (the two corresponding distributions fully overlap), as well as the profile of TG–BODIPY-incubated cells right after the washing step. The peak autofluorescence of the cells and the peak fluorescence intensity of 1 h TG–BODIPY-incubated cells are indicated by dashed lines. The quantification of two or three independent experiments (labeled with different symbols) is depicted on the right-hand side of the flow cytometry graphs. The latter are derived from the experiment corresponding to the gray symbols. The bars represent the mean of the cytometry distribution profiles. a.u., arbitrary units.
