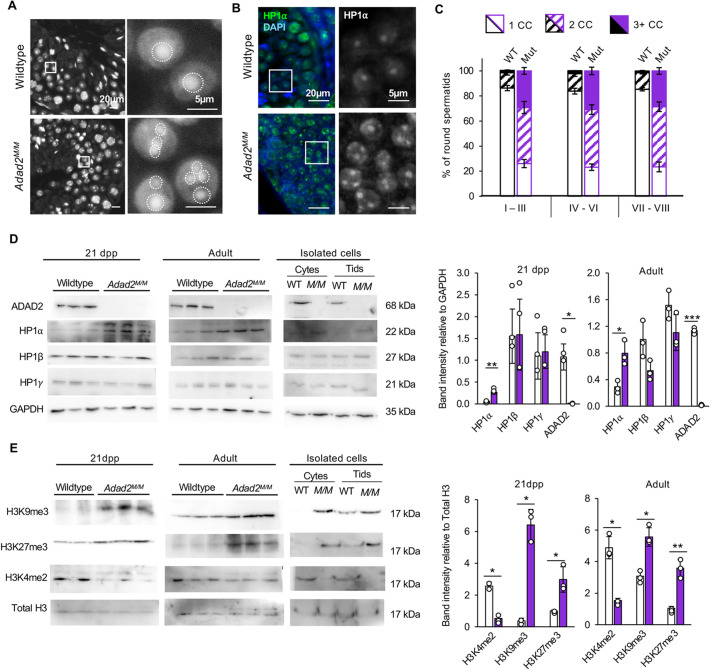
Fig. 1.
Adad2 mutant meiotic spermatocytes and post-meiotic spermatids have abnormal localization and increased levels of heterochromatin. (A) DAPI-stained adult wild-type and Adad2 mutant (Adad2M/M) stage-matched tubules show a single DAPI-intense focus (chromocenter) in wild-type round spermatids and an increased number of DAPI-intense foci in mutant round spermatids. The area outlined in the images on the left is shown in more detail on the right. Dashed circles indicate DAPI-intense foci. Quantification of DAPI-intense foci demonstrates a significant increase in mutant spermatids. (B) Immunofluorescence of HP1α in wild-type and Adad2 21 dpp testis reveals a single HP1α focus in wild-type spermatids and multiple foci in mutant spermatids, consistent with abnormal chromocenter number in mutants. The area outlined in the images on the left is shown in more detail on the right. Green indicates HP1α, blue indicates DAPI. HP1α only is shown on the right. (C) Chromocenter number by stage in adult wild-type and Adad2M/M round spermatids (three biological samples per genotype) demonstrating high chromocenter number throughout development in mutant cells. Error bars indicate s.d. (D) Western blot of HP1 proteins in 21 dpp and adult whole-testis lysate from wild-type and Adad2M/M samples (three biological samples per genotype) and from enriched pools of adult wild-type and Adad2M/M spermatocytes and spermatids (pooled across three biological samples per genotype). ADAD2 and GAPDH are genotype and loading controls, respectively. The 21 dpp ADAD2 genotype control and GAPDH loading control blots are also shown for the same protein panel in Fig. 3A, Fig. S5B,D and Fig. S6D. The adult ADAD2 genotype control and GAPDH loading control blots are also shown for the same protein sample panel in Fig. S5D. Quantification of band intensity confirms a significant increase of HP1α in mutants at both ages. (E) Western blot of select epigenetic marks in 21 dpp and adult whole-testis histone lysate from wild-type and Adad2M/M samples (n=2 samples for 21 dpp wild type; n=3 for all others) and enriched pools of adult wild-type and Adad2M/M spermatocytes and spermatids (pooled across three biological samples per genotype) with total histone 3 (H3) as a loading control. The 21 dpp total H3 loading control blot is also shown for the same protein sample panel in Fig. S6A. Quantification of band intensity shows increased heterochromatin, measured by H3K9me3 and H3K27me3, and decreased euchromatin, measured by H3K4me2. Throughout, dots represent individual samples; data are mean±s.d. Significance was calculated using an unpaired, two-tailed Student‘s t-test (*P<0.05, **P<0.001, ***P<0.0001).

