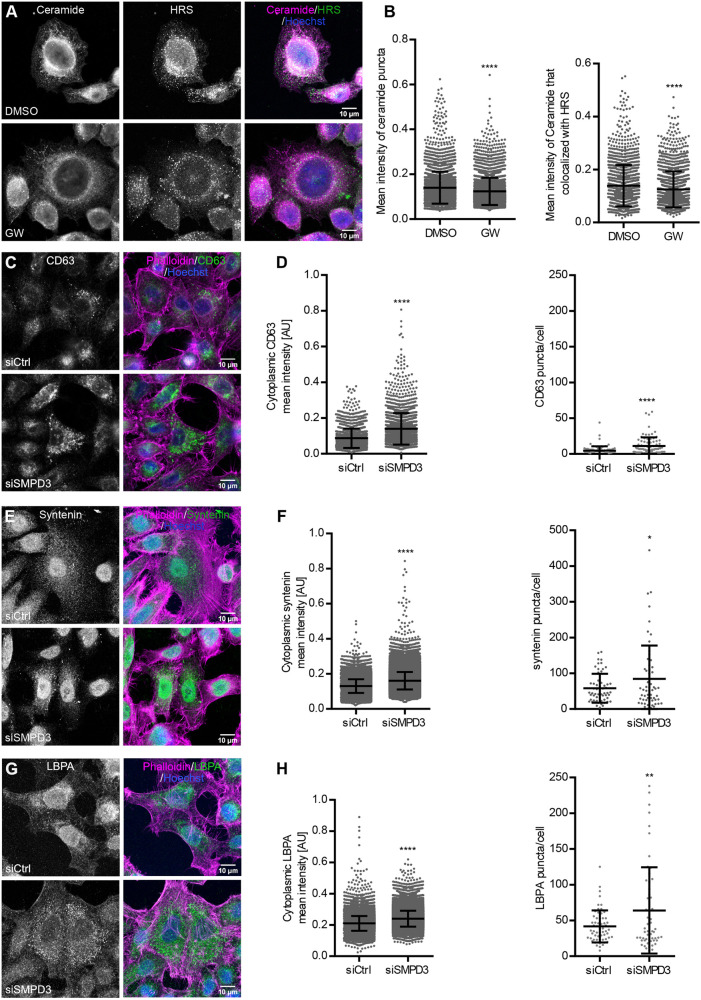
Fig. 2.
SMPD3 KD results in intracellular accumulation of MVBs. (A) Confocal microscopy images of HeLa cells treated with DMSO or GW4869 (GW), stained for ceramide and HRS. Nuclei were stained with Hoechst. (B) Dot plots of mean fluorescence intensity of ceramide puncta (left) and mean fluorescence intensity of ceramide puncta that colocalized with HRS (right) from A. (C–H) Confocal microscopy images of control (siCtrl) and SMPD3 KD (siSMPD3) HeLa cells stained for exosomal markers CD63 (C) and syntenin (E), and the MVB marker LBPA (G), as well as actin (phalloidin). Nuclei were stained with Hoechst. (D) Quantifications of cytoplasmic CD63 intensity (left) and CD63 puncta per cell (right) from C. (F) Quantifications of cytoplasmic syntenin intensity (left) and syntenin puncta per cell (right) from E. (H) Quantifications of cytoplasmic LBPA intensity (left) and LBPA puncta per cell (right) from (G). The data in B,D,F and H are presented as mean±s.d.; n>50 cells from two biological replicates for each staining. *P<0.01; **P<0.001; ****P<0.0001 (unpaired, two-tailed Student's t-test). AU, arbitrary units.

