Fig. 5.

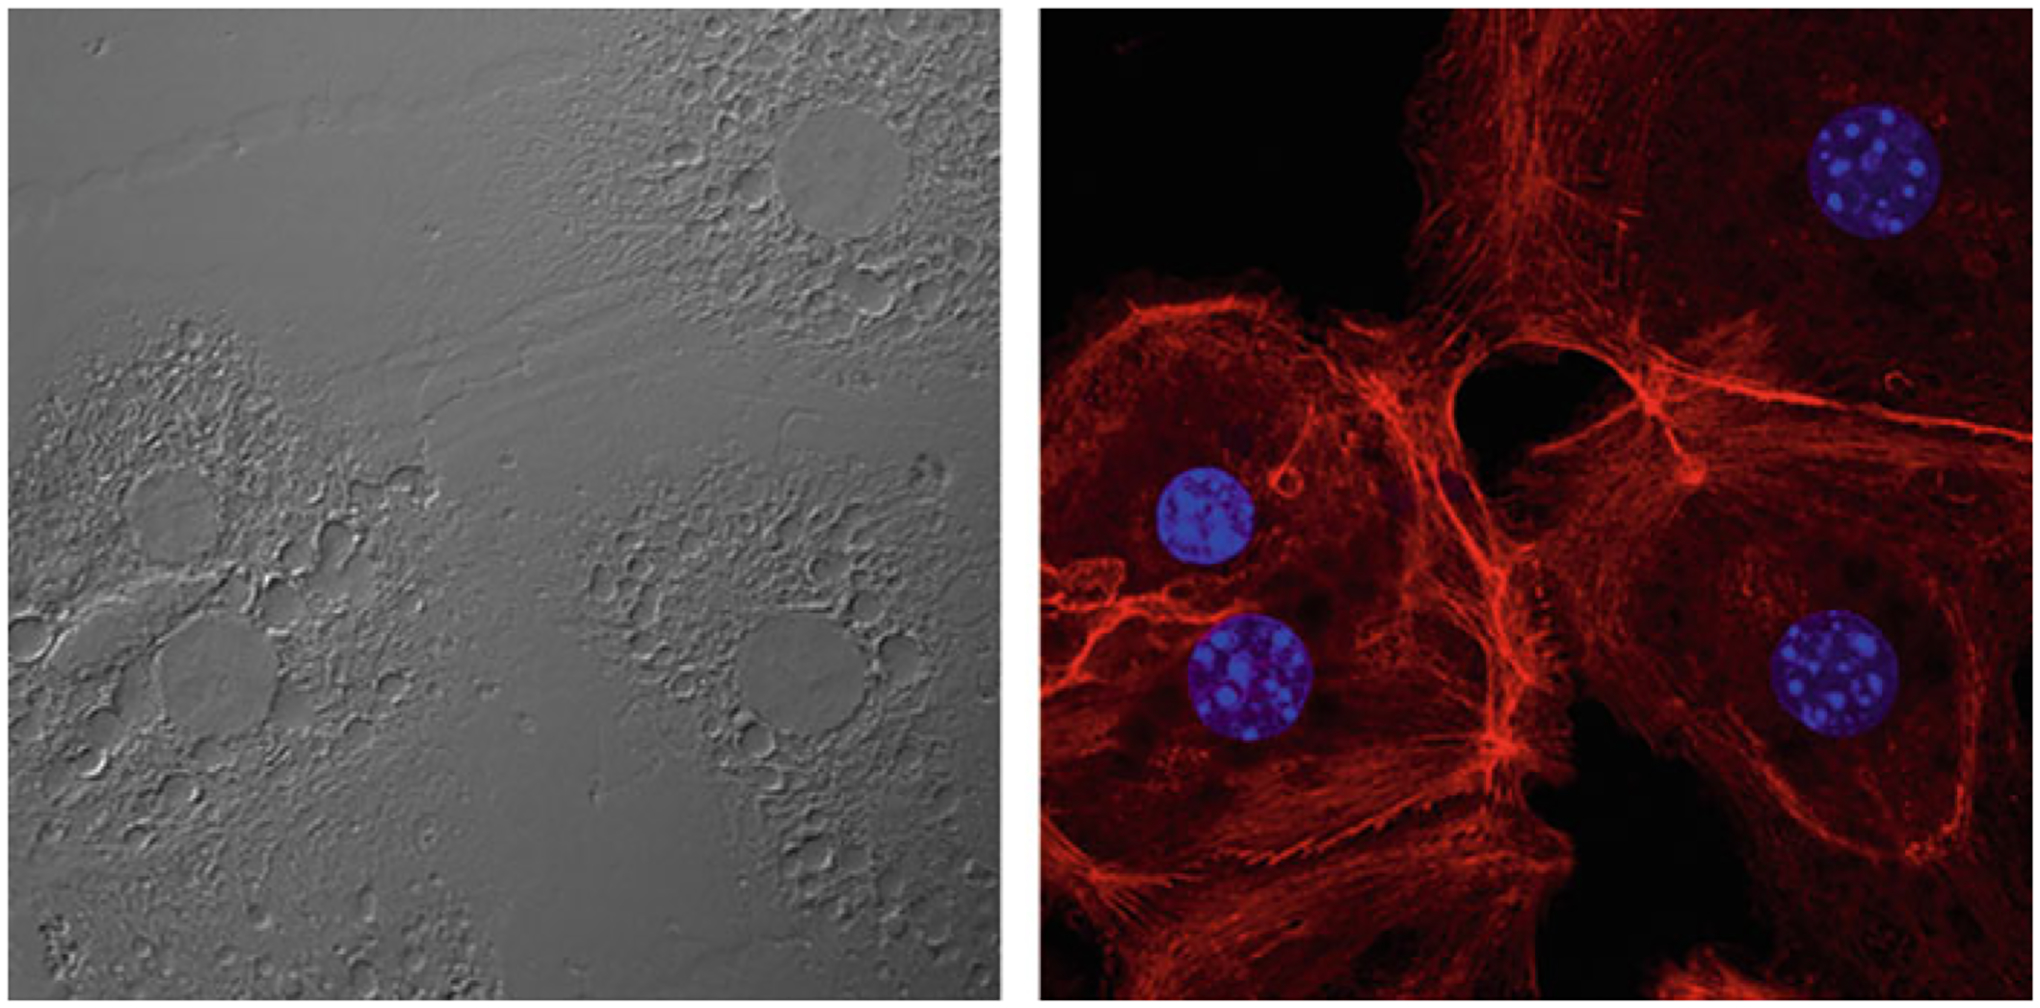
Representative image of the isolated hepatocytes. (Left panel) bright-field image. (Right panel) Stained with Rhodamine phalloidin to visualize the actin cytoskeleton (red) and DAPI (blue)

Representative image of the isolated hepatocytes. (Left panel) bright-field image. (Right panel) Stained with Rhodamine phalloidin to visualize the actin cytoskeleton (red) and DAPI (blue)