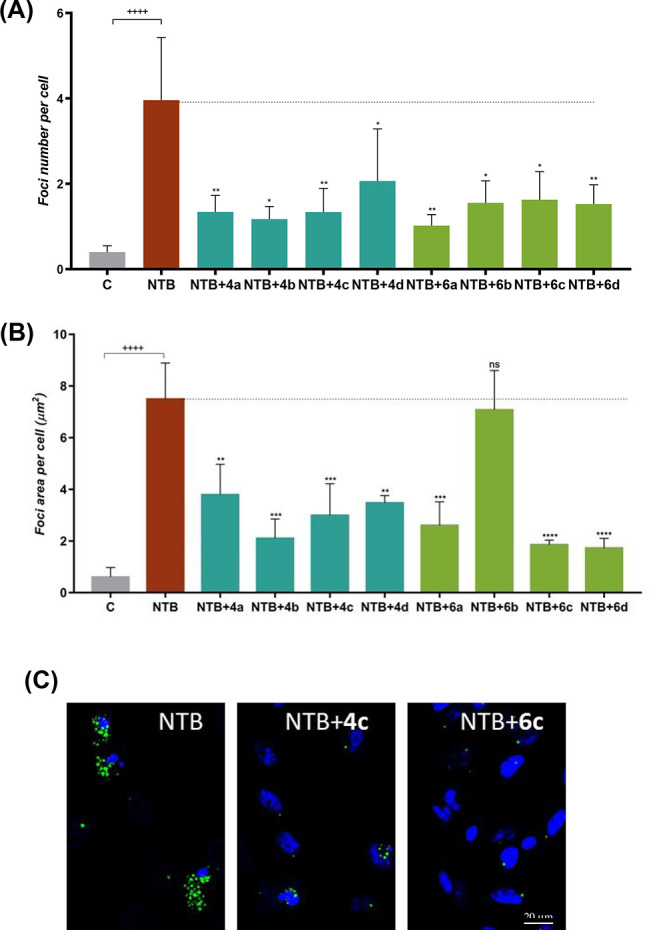
Figure 4.

Analyses of the disaggregation capacities of compounds 4a–d and 6a–d under conditions of general protein aggregation. (A) Numbers and (B) average areas of green-fluorescing foci of protein aggregates per cell. Control and NTB-exposed cells were grown in the presence of 0.5% EtOH (compound vehicle). Data are presented as mean ± SD (n = 4–10, average of a total of ∼4700 cells analyzed per condition). Significance was determined using the unpaired Student’s t test: (+) for comparison between positive (NTB) and negative (C) control conditions and (*) for comparison between NTB and NTB + compounds. +/*, p < 0.05; ++/**, p < 0.01; +++/***, p < 0.001; ++++/****, p < 0.0001. (C) Micrographs of representative cells of compounds 4c and 6c. Aggregates are in green (HSP27:GFP fusion protein) and cell nuclei in blue (DAPI).
