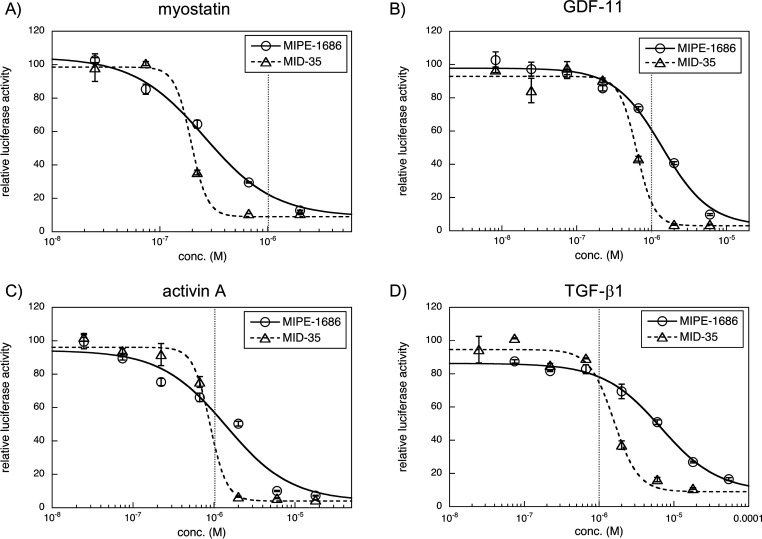
Figure 3.
Luciferase reporter assays to evaluate the dose-dependent inhibition by MIPE-1686 and MID-35 against myostatin (A), GDF-11 (B), activin A (C), and TGF-β1 (D). Cells, HEK293-cell-transfected Smad-responsive reporter (pGL4.48[luc2P/SBE/Hygro]) and control (pGL4.74[hRluc/TK]) plasmids; peptide concentration, 0.025–2 μM (A), 0.08–6 μM (B), 0.025–18 μM (C), and 0.025–18 μM for MID-35 or 0.074–54 μM for MIPE-1686 (D); positive control (SB431542) concentration, 5 μM; myostatin, GDF-11, and activin A concentrations, 8 ng/mL (0.32 nM); TGF-β1 concentration, 2.5 ng/mL (0.1 nM); starvation with serum-free DMEM, 8 h; incubation with or without peptides, 4 h. Values represent means ± SD (N = 3). Curve fitting was performed using KaleidaGraph 4.5. The sigmoidal curve is normalized with the minimum values in each assay. The vertical dotted line (gray) represents a concentration of 1 μM.

